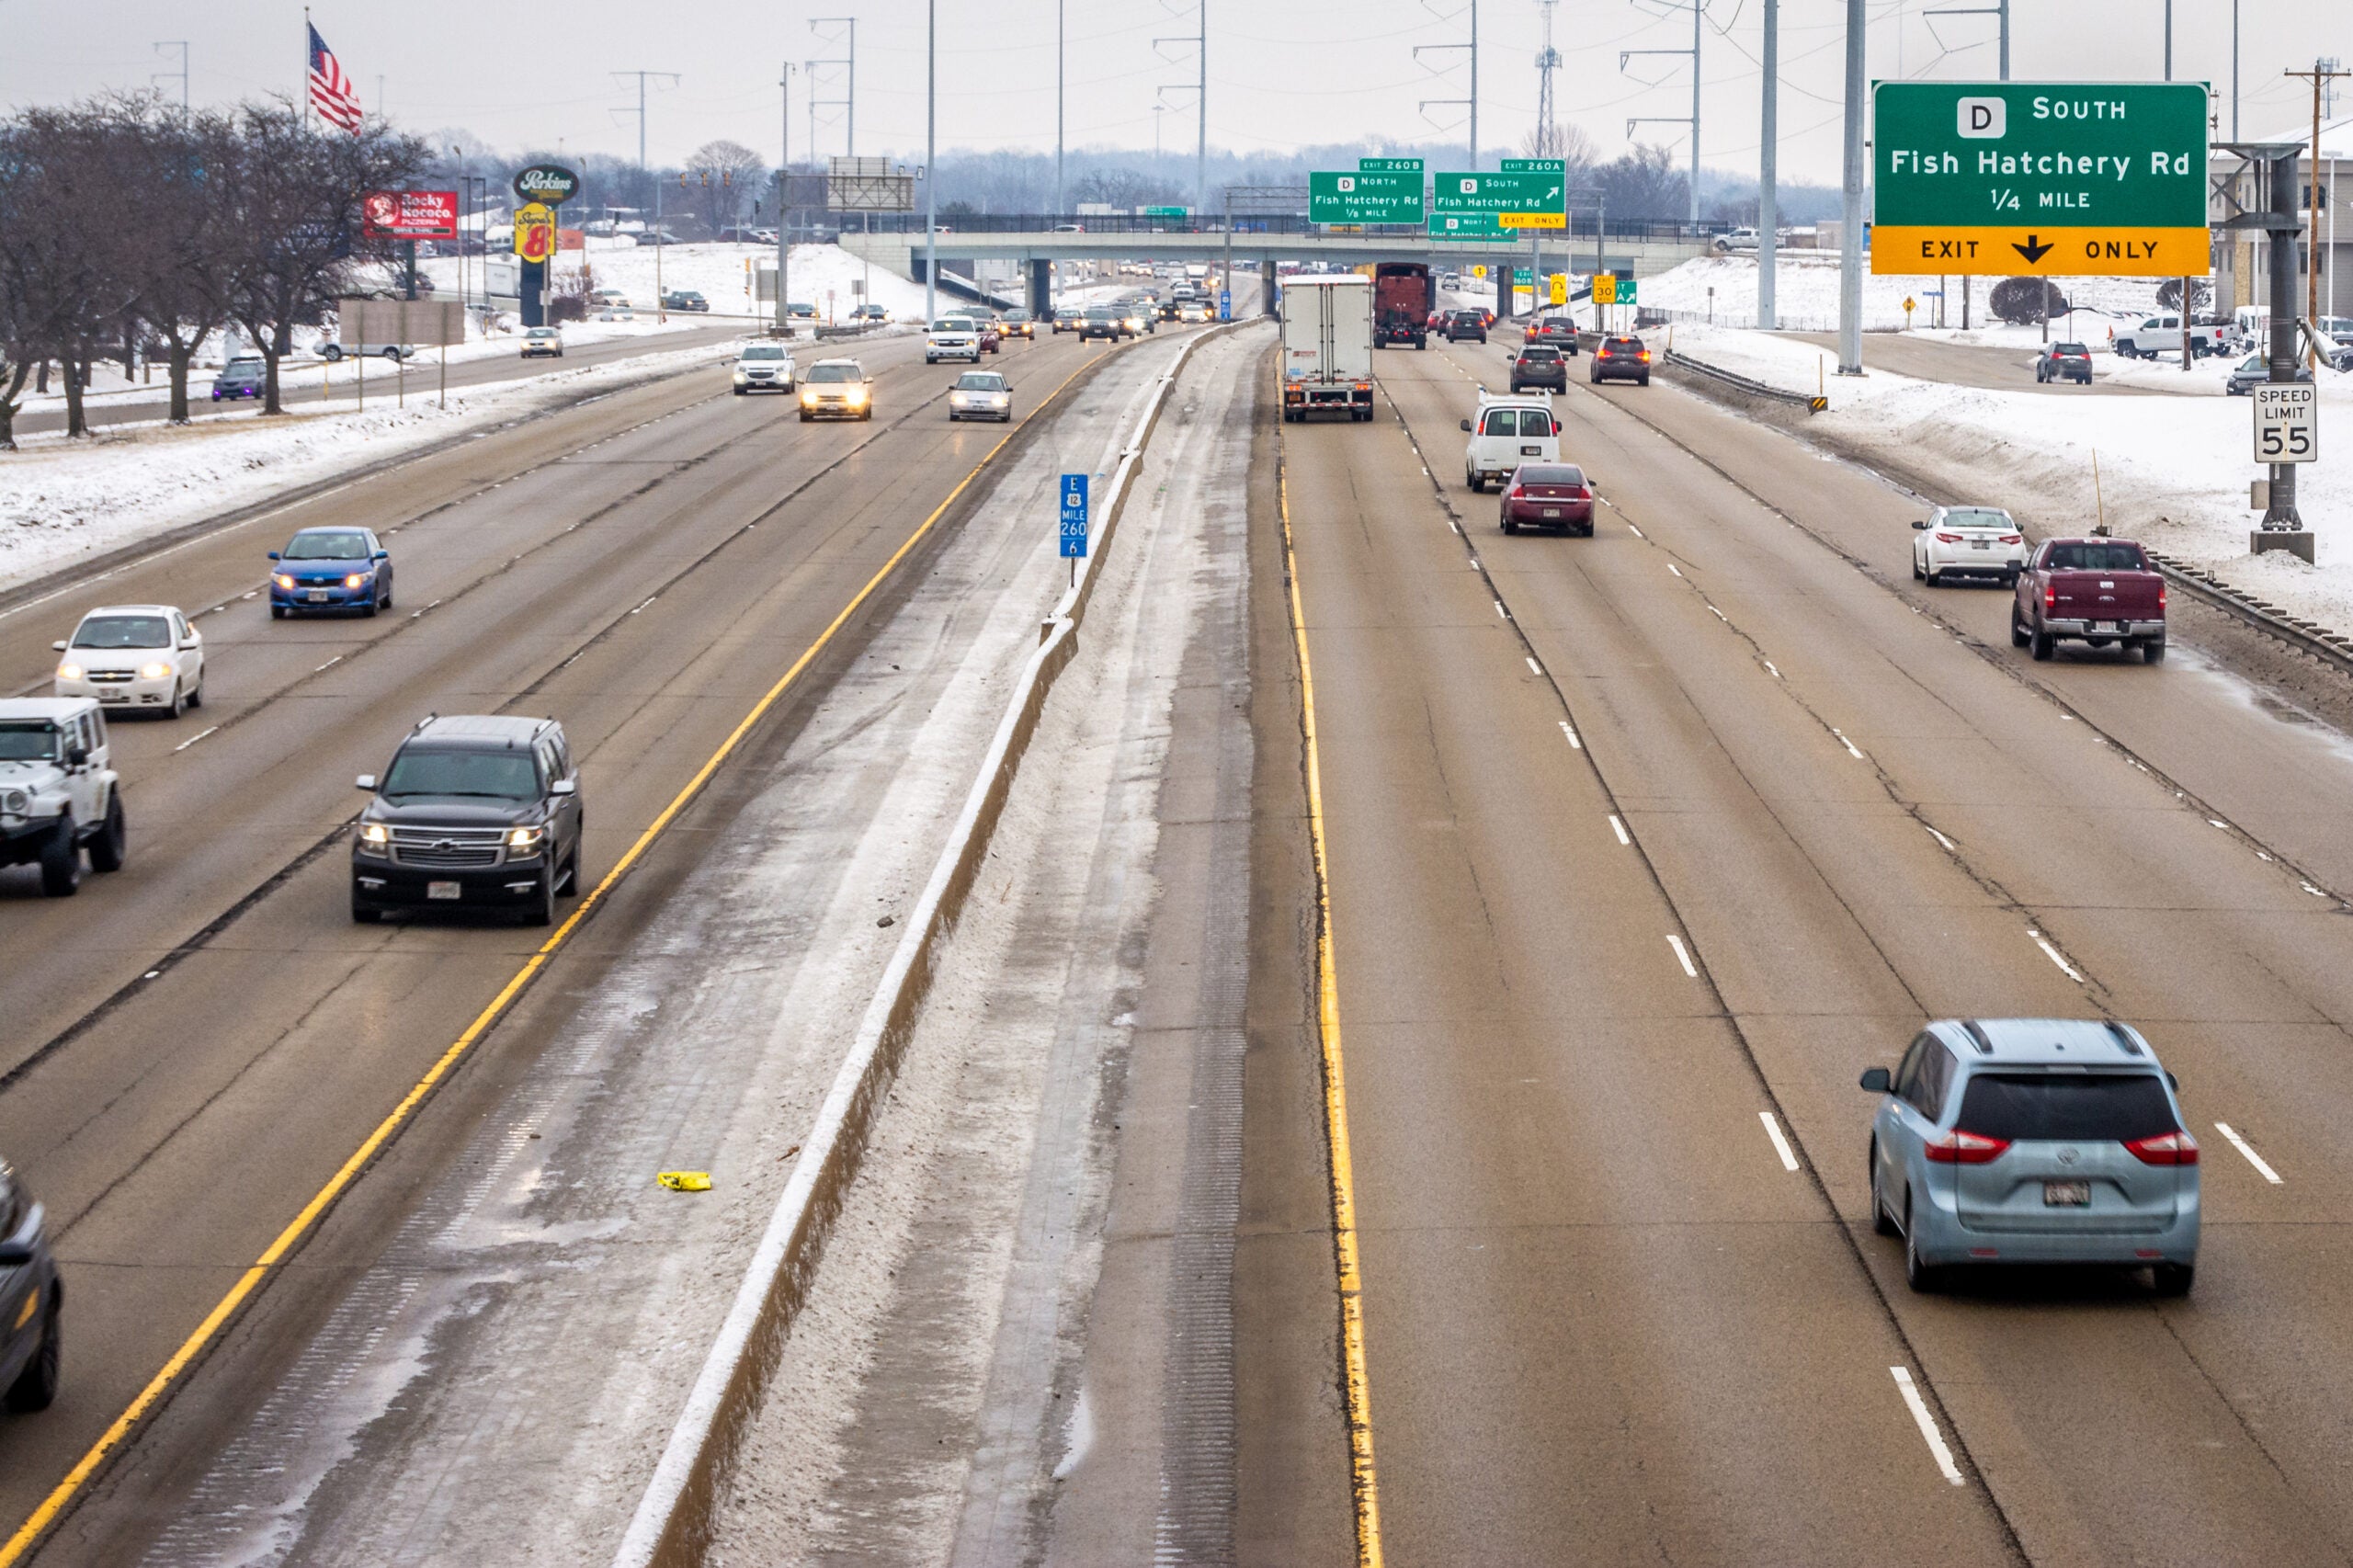
More than two years after the start of the COVID-19 pandemic, Wisconsin drivers still aren’t commuting as much as they used to, according to a review of traffic data by a public policy think tank.
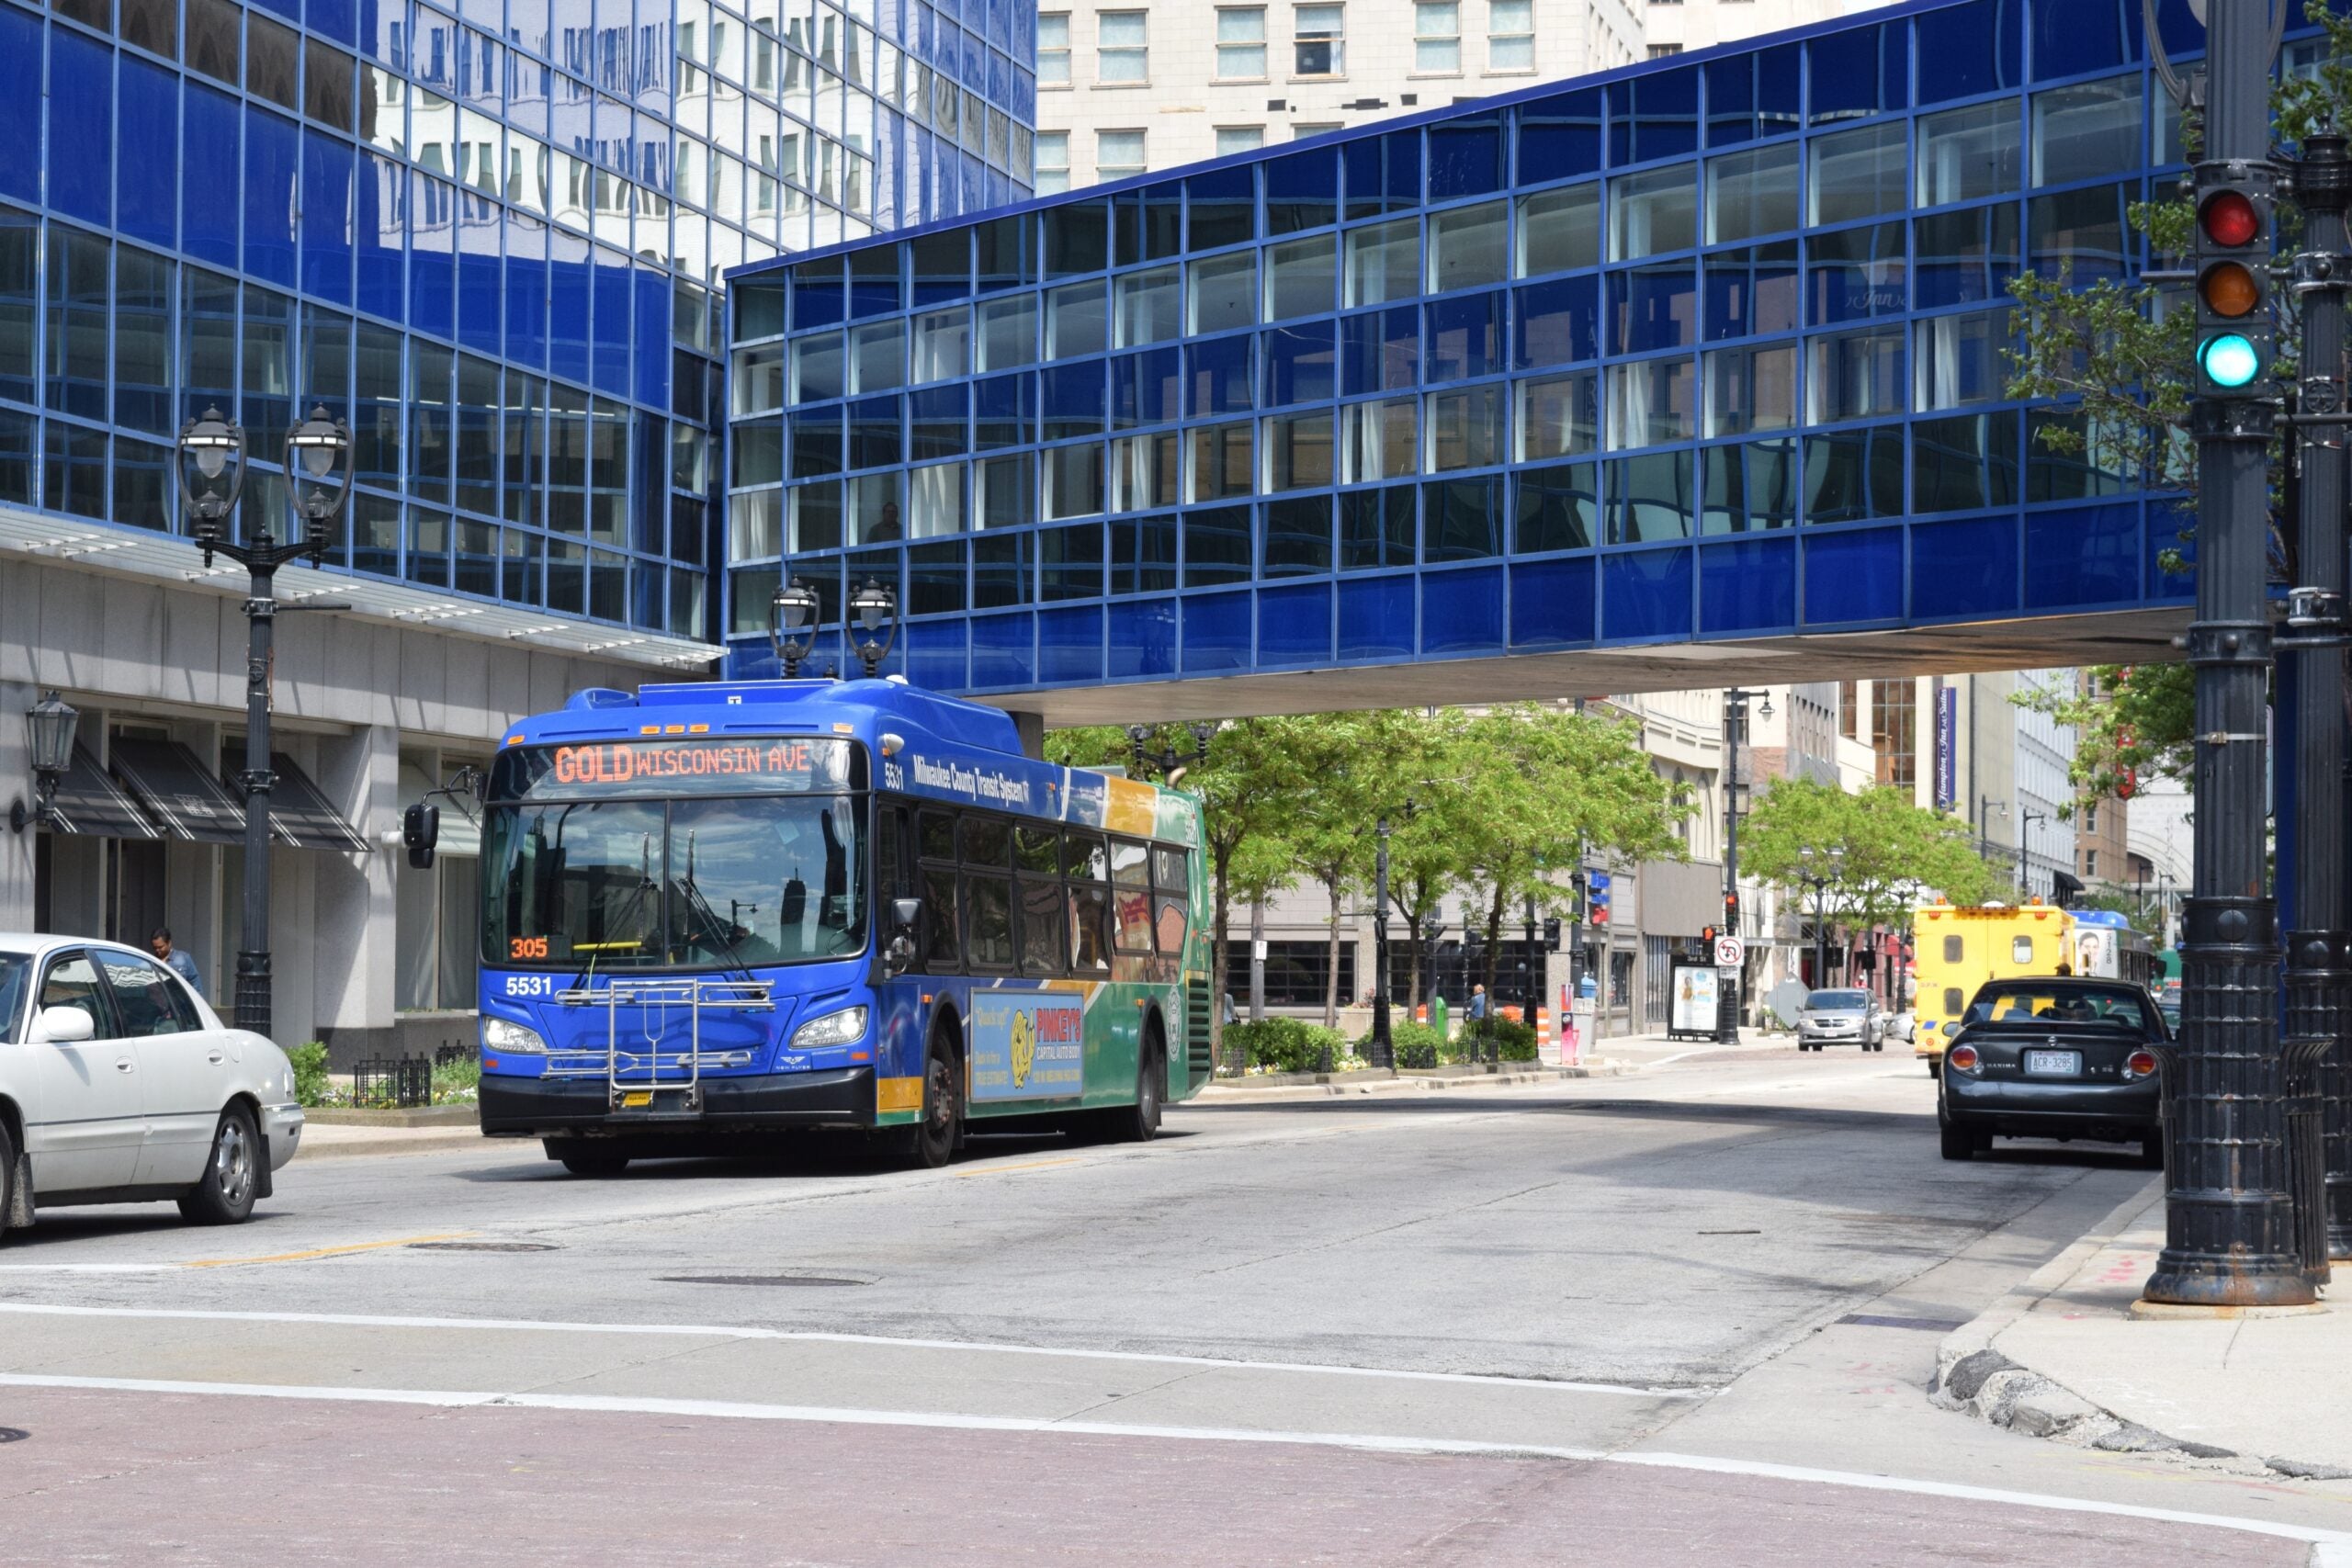
And while weekday auto traffic has dipped slightly, transit usage has dropped dramatically, with bus ridership down about 50 percent across nine Wisconsin cities.
The study by the Wisconsin Policy Forum used data from the Wisconsin Department of Transportation to measure auto traffic and data from the Federal Transit Administration to measure bus ridership.
News with a little more humanity
WPR’s “Wisconsin Today” newsletter keeps you connected to the state you love without feeling overwhelmed. No paywall. No agenda. No corporate filter.
Not all traffic has changed equally.
Weekend traffic has largely returned to normal, according to the report. For example, in six out of the past 12 months, weekend traffic exceeded pre-pandemic levels.
In addition, DOT data show truck traffic in March was up by 7 percent compared to March 2019.
But on weekdays, traffic remains down compared to pre-pandemic levels, with the sharpest declines during the morning and evening hours when residents typically commute. Weekday traffic in March was down 5.2 percent compared to March 2019, according to the Wisconsin Policy Forum. The report found there hasn’t been a single month when weekday traffic was higher than it was before the pandemic.
“I think that there’s definitely a potential for things to change over the course of the next couple of months this summer, and also over the course of the next couple years,” said Wisconsin Policy Forum senior research associate Ari Brown. “But there’s definitely a chance that this is just the new reality that we’re in when it comes to car traffic.”
[[{“fid”:”1693031″,”view_mode”:”full_width”,”fields”:{“alt”:”A graph showing the change in average daily traffic volume by month compared to same month pre-pandemic from March 2020 to March 2022″,”title”:”A graph showing the change in average daily traffic volume by month compared to same month pre-pandemic from March 2020 to March 2022″,”class”:”media-element file-full-width”,”data-delta”:”1″,”format”:”full_width”,”alignment”:””,”field_image_caption[und][0][value]”:”%3Cp%3EA%20graph%20showing%20the%20change%20in%20average%20daily%20traffic%20volume%20by%20month%20compared%20to%20same%20month%20pre-pandemic%20from%20March%202020%20to%20March%202022%20in%20Wisconsin.%20%3Cem%3EGraph%20courtesy%20of%20Wisconsin%20Policy%20Forum%3C%2Fem%3E%3C%2Fp%3E%0A”,”field_image_caption[und][0][format]”:”full_html”,”field_file_image_alt_text[und][0][value]”:”A graph showing the change in average daily traffic volume by month compared to same month pre-pandemic from March 2020 to March 2022″,”field_file_image_title_text[und][0][value]”:”A graph showing the change in average daily traffic volume by month compared to same month pre-pandemic from March 2020 to March 2022″},”type”:”media”,”field_deltas”:{“1”:{“alt”:”A graph showing the change in average daily traffic volume by month compared to same month pre-pandemic from March 2020 to March 2022″,”title”:”A graph showing the change in average daily traffic volume by month compared to same month pre-pandemic from March 2020 to March 2022″,”class”:”media-element file-full-width”,”data-delta”:”1″,”format”:”full_width”,”alignment”:””,”field_image_caption[und][0][value]”:”%3Cp%3EA%20graph%20showing%20the%20change%20in%20average%20daily%20traffic%20volume%20by%20month%20compared%20to%20same%20month%20pre-pandemic%20from%20March%202020%20to%20March%202022%20in%20Wisconsin.%20%3Cem%3EGraph%20courtesy%20of%20Wisconsin%20Policy%20Forum%3C%2Fem%3E%3C%2Fp%3E%0A”,”field_image_caption[und][0][format]”:”full_html”,”field_file_image_alt_text[und][0][value]”:”A graph showing the change in average daily traffic volume by month compared to same month pre-pandemic from March 2020 to March 2022″,”field_file_image_title_text[und][0][value]”:”A graph showing the change in average daily traffic volume by month compared to same month pre-pandemic from March 2020 to March 2022″}},”link_text”:false,”attributes”:{“alt”:”A graph showing the change in average daily traffic volume by month compared to same month pre-pandemic from March 2020 to March 2022″,”title”:”A graph showing the change in average daily traffic volume by month compared to same month pre-pandemic from March 2020 to March 2022″,”class”:”media-element file-full-width”,”data-delta”:”1″}}]]The declines in bus ridership were even more pronounced when looking at federal data covering Milwaukee County and the cities of Appleton, Eau Claire, Green Bay, Kenosha, Madison, Oshkosh, Racine and Waukesha. In 2019, Wisconsin residents rode on those transit systems 48.5 million times, according to the report. In 2021, ridership was down to 22.6 million.
Brown said the drop was most pronounced in Madison, where transit ridership has been down 65 percent or more since the first full month of the pandemic in April 2020.
“Especially in a place like Madison … you have a very high concentration of people with white collar-type jobs,” Brown said. “We kind of feel that the thread that connects all of these things is there’s just less commuting happening in general, with … a kind of increased ability to work from home.”
Brown said if these numbers represent a “new normal,” it could raise issues for officials in state and local governments. A decline in driving could result in a decline in the gas tax revenues that fund roads.
Additionally, Brown said it might be worth considering how to prioritize transportation spending, possibly by focusing more on bicycle and pedestrian traffic.

Wisconsin Public Radio, © Copyright 2026, Board of Regents of the University of Wisconsin System and Wisconsin Educational Communications Board.