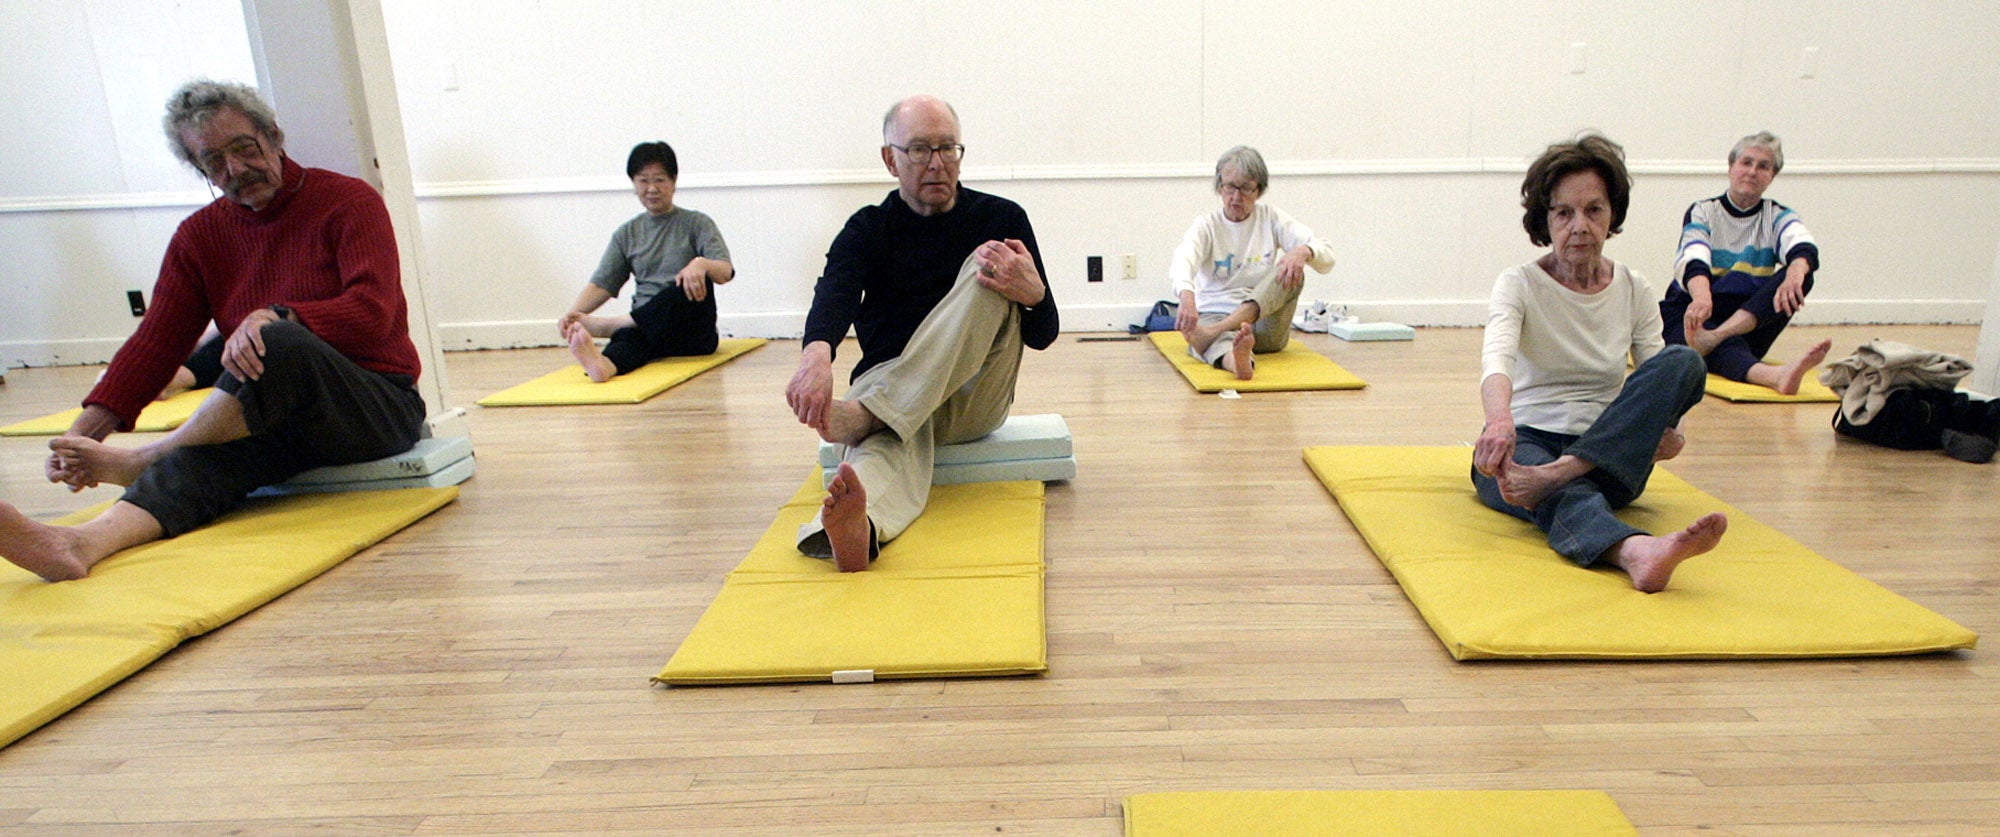

The rate at which Wisconsin’s “prime working age” adults are either working or looking for work is among the best in the country, according to a recent report from the University of Wisconsin-Extension.
Economists describe prime working age as individuals between 25 and 54 years old because that demographic typically has the highest labor force participation rates. Those rates measure the share of the population that’s working or seeking jobs.
In 2021, Wisconsin had the fifth-highest labor force participation rate in the country for prime working age women and the ninth highest for prime working age men, the UW-Extension report said.
News with a little more humanity
WPR’s “Wisconsin Today” newsletter keeps you connected to the state you love without feeling overwhelmed. No paywall. No agenda. No corporate filter.
“It speaks a lot to our work ethic,” said Matt Kures, the report’s author and a community economic development specialist for UW-Extension. “Traditionally, we have had high participation rates and I think that’s just kind of ingrained in us.”
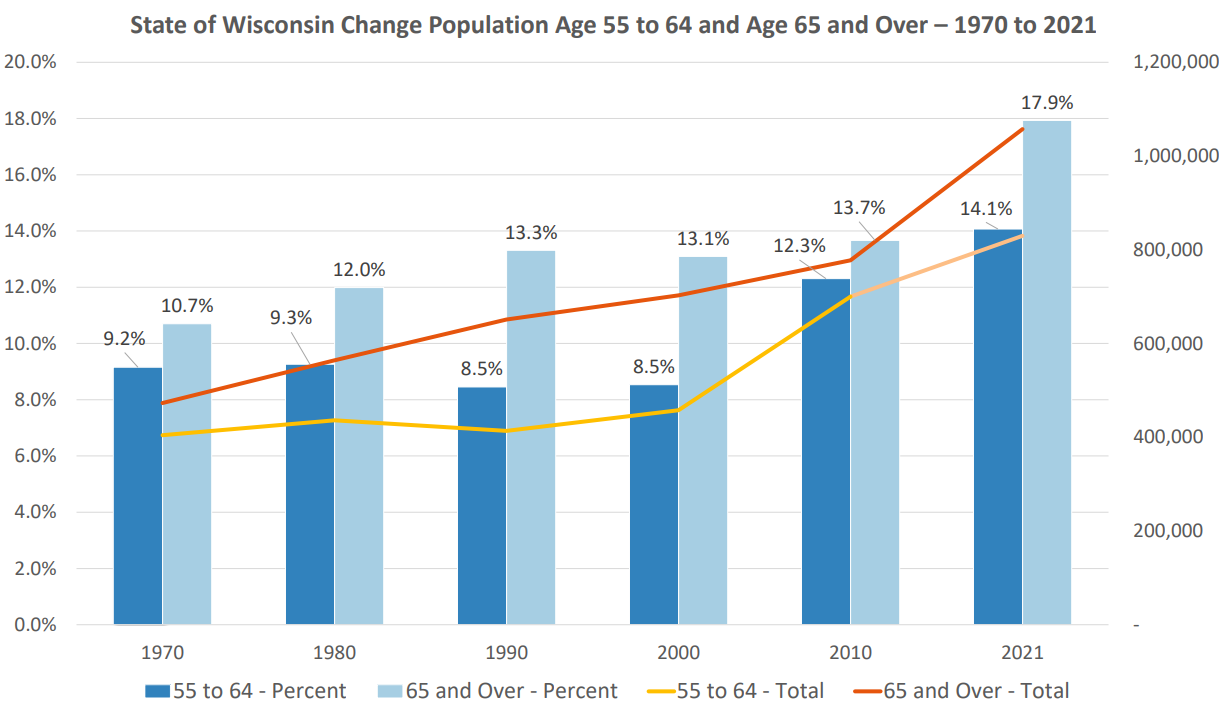
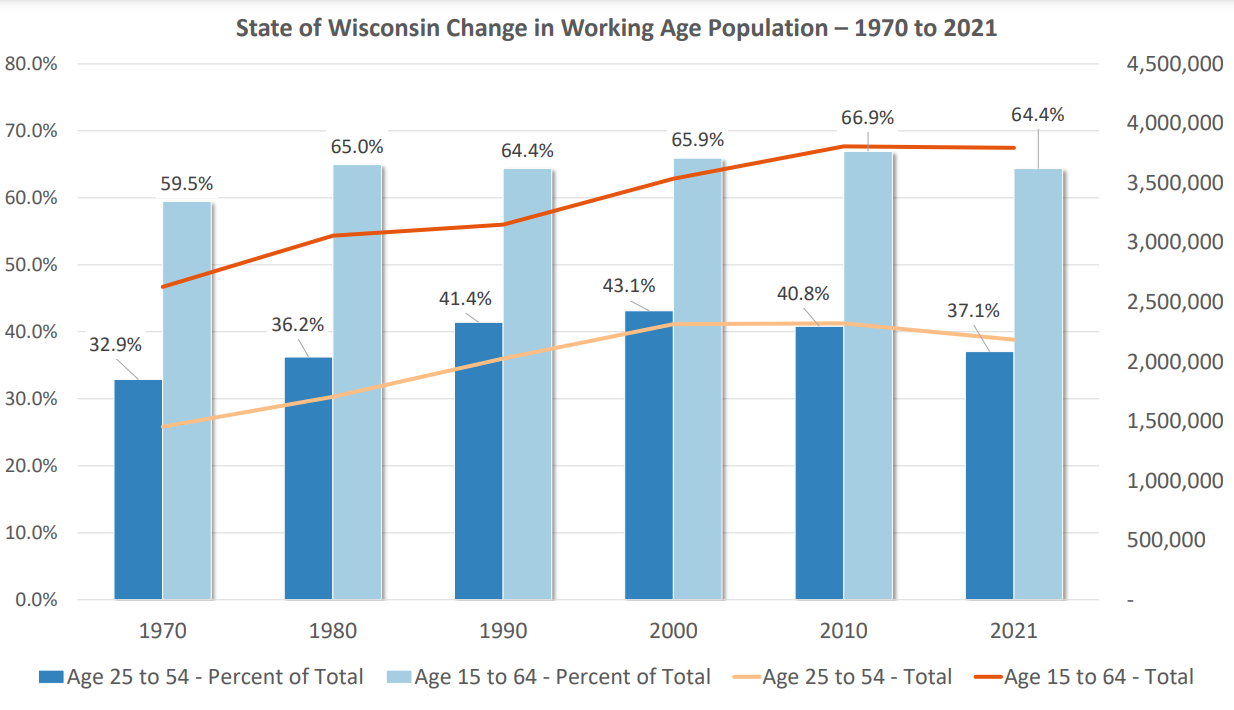
He said overall annualized labor force participation data for 2022 is still preliminary. But the share of the state’s population that’s considered prime working age has been declining since around 2000 as both the 55- to 64-year-old and 65-plus demographics have been increasing, according to research from Kures.
For example, people 55 and older made up 21.6 percent of the state’s population in 2000. By 2021, they made up 32 percent. During the same period, prime working age Wisconsinites went from representing 43.1 percent of the population to 37.1 percent, while the state’s overall labor force participation rate has been trending downward.
“One of the biggest factors pushing our overall participation rate down is just our aging demographics,” Kures said. “That explains a very large share of the overall decline in our participation rates.”
If Wisconsin doesn’t improve efforts to attract and retain young people, its working age population could shrink by 130,000 by the end of the decade, according to Forward Analytics, the research arm of the Wisconsin Counties Association.
Workforce participation rates trending down for decades
While Wisconsin’s prime working age labor force participation remains among the highest in the country, it has declined over the last several decades.
In 2000, the labor force participation rate among prime working age men was 94 percent, according to Kures’ research. Participation rates among that demographic last year was 90.8 percent. Meanwhile, labor force participation rates for prime working age women fell from 84.7 percent in 2000 to 78.7 percent in 2022.
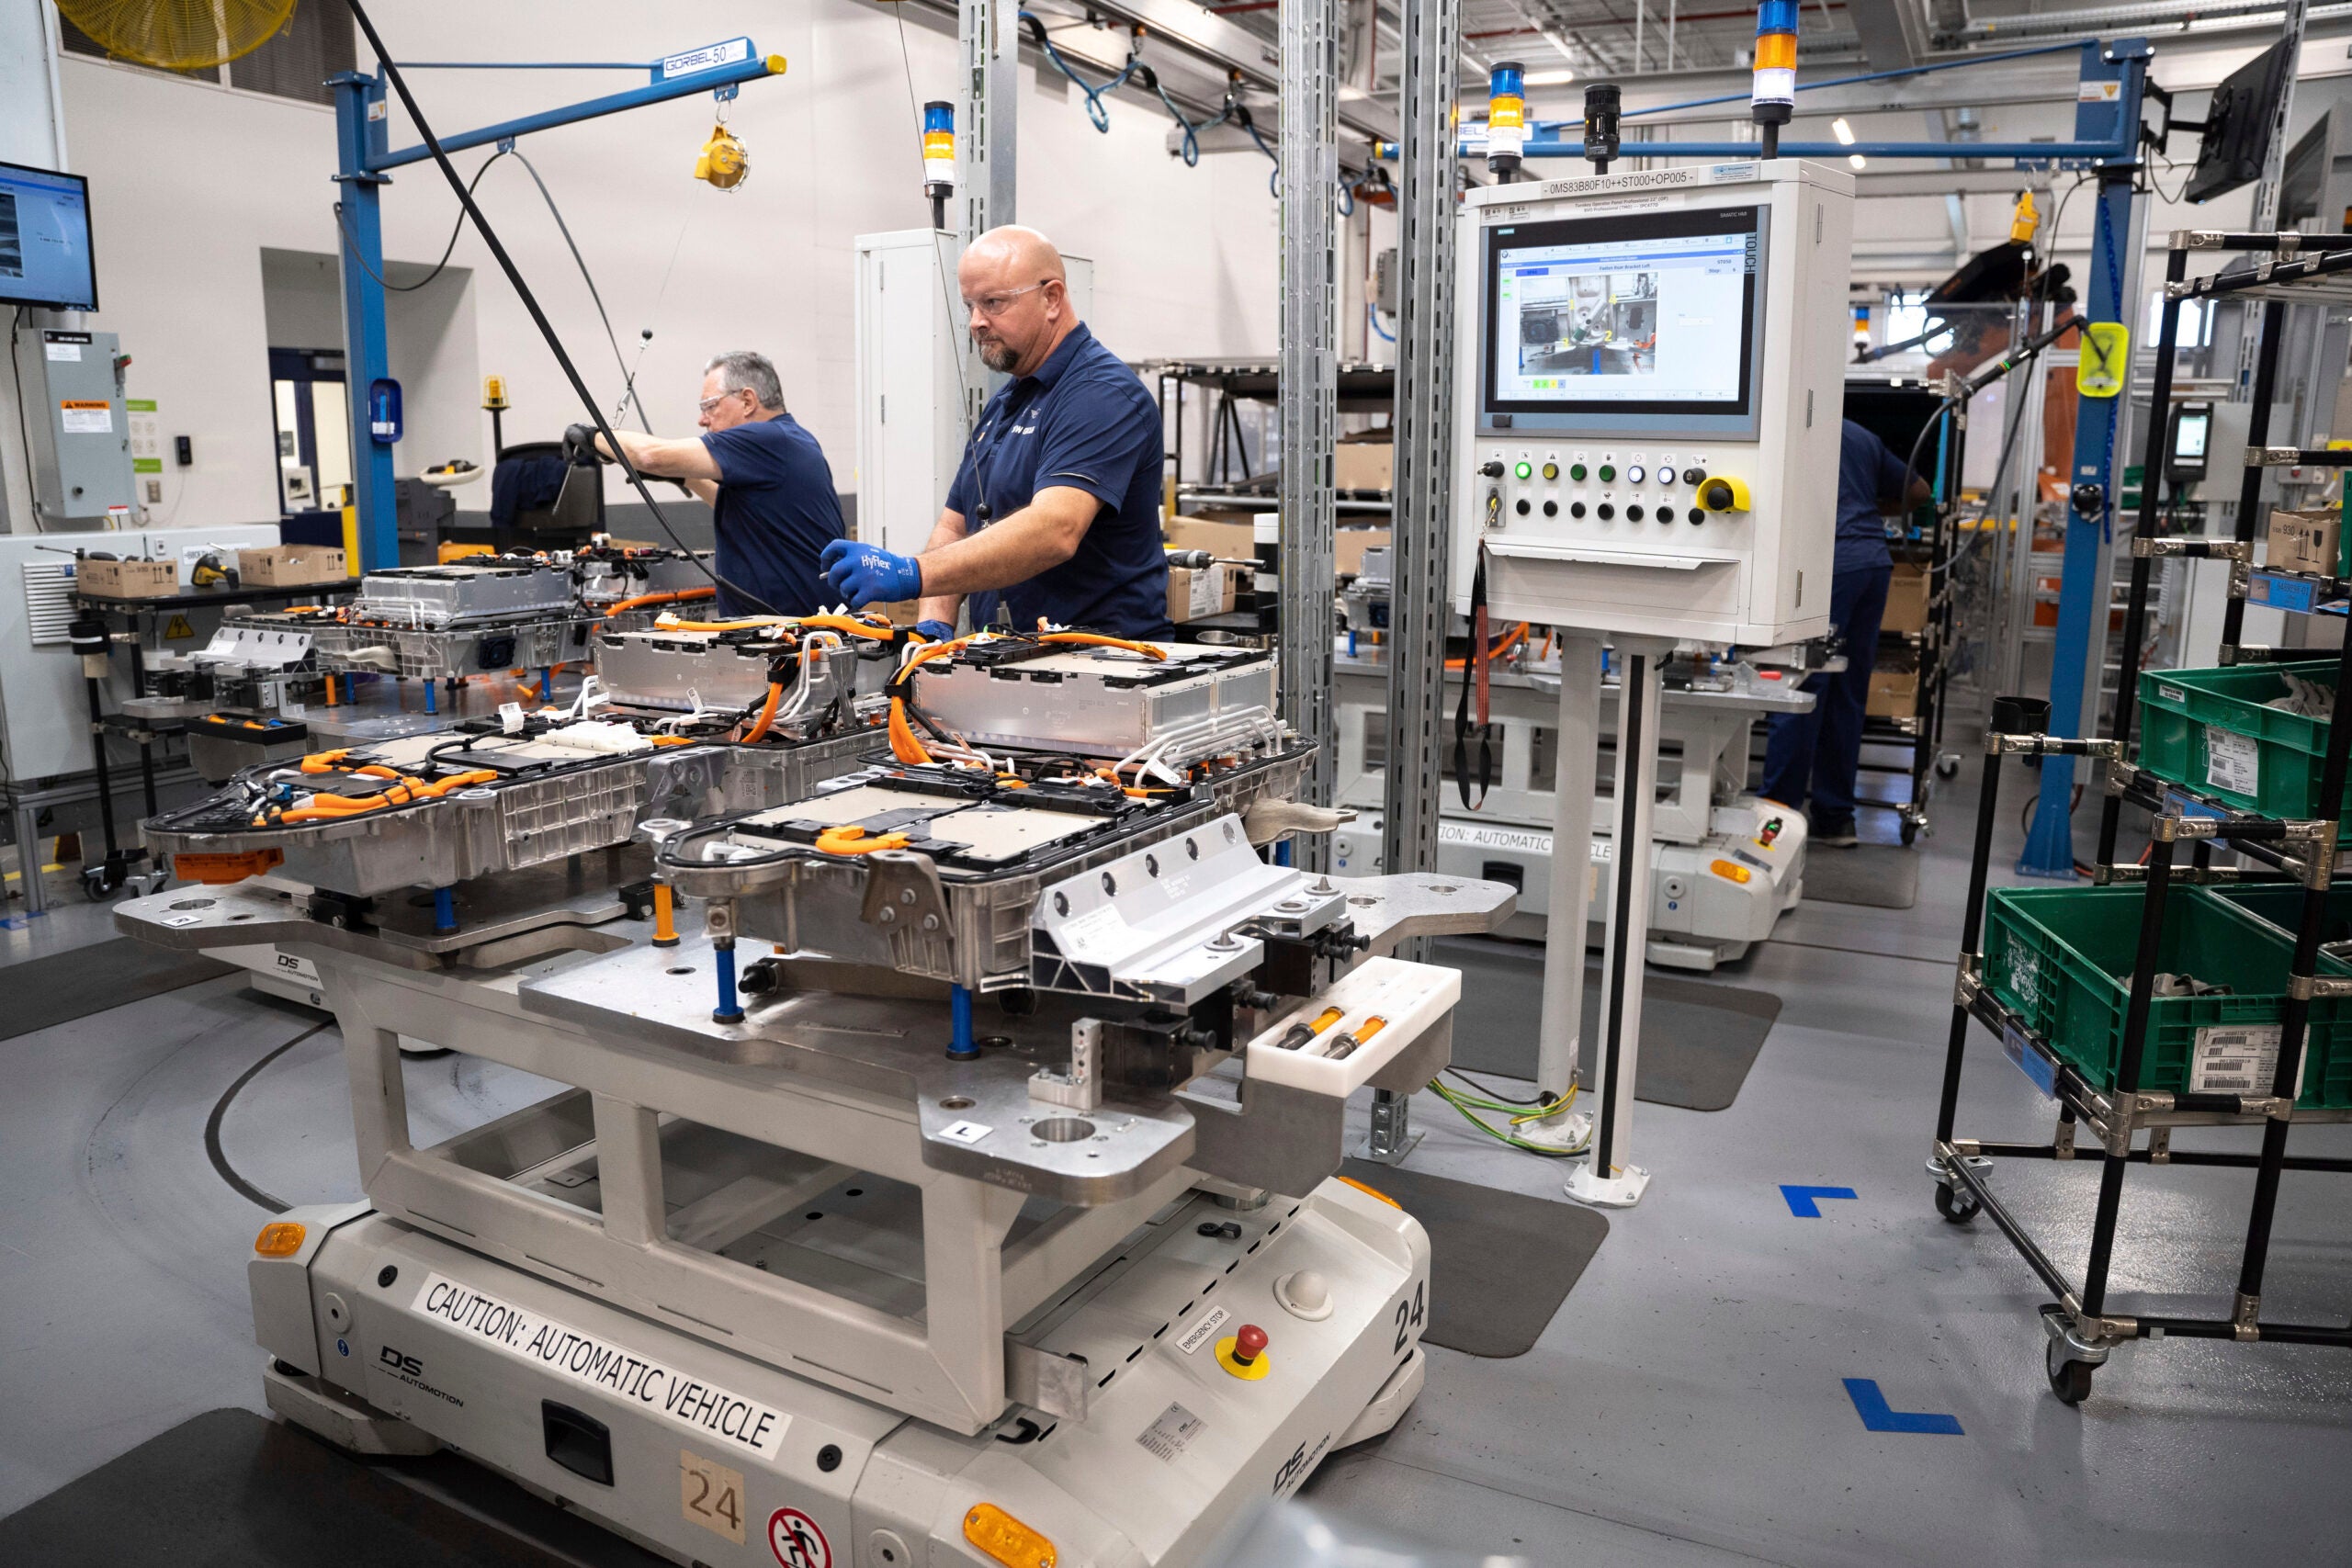
Kures said those declines are part of a larger national trend he attributed to a variety of factors. Those include things like increased automation, a mismatch of skills for available jobs, labor barriers, long-term employment gaps and an upward trend in disability rates over time.
He also said there’s a disparity in labor force participation rates between prime working age men and women — with men participating at higher rates. Kures said that’s primarily due to child care costs.
According to the Economic Policy Institute, the average cost of infant care in Wisconsin is $12,567 annually, or $1,047 per month. Laura Dresser, associate director of the COWS economic think tank at UW-Madison, said women in the workforce feel the effects of that most.
“Moms tend to carry the burden of care disproportionately in families,” she said. “The years before the kid goes to school … are really expensive years to work.“
Despite those obstacles, she said the high labor force participation relative to other states, especially among Wisconsin women, highlights the state’s commitment to labor.
“You see a lot of commitment to work in this state and a lot of evidence, especially of the commitment of women to work in a state,” she said. “That’s the population that most exceeds their national counterpart. Supporting women’s (ability to) work strikes me as a way to continue to help build the labor force.”
Among Wisconsin teens aged 16 to 19, labor force participation has gone from 66.5 percent in 2000 to 56.5 percent in 2022, according to Kures’ data. That still exceeds the national rate among teens, which was 36.8 percent in 2022.
Kures said he attributed the decline in teen labor force participation to decreasing high school dropout rates over time and a bigger emphasis by families on education.
“It may be that your job is to go to school to create an opportunity for some sort of post-secondary education,” he said of today’s teenagers. “You may be in a lot of extracurricular activities, such as sports, so it just doesn’t create as much time for kids to have a job as they did 20 years ago.”
Pandemic retirements may have played a role in the overall labor force declines
Kures said the COVID-19 pandemic may have been a factor for declining labor force participation among 55- to 64-year-olds. His data shows that labor force participation among that demographic was roughly 70 percent prior to the pandemic, but was 67.6 percent in 2022.
And a recent paper by the Federal Reserve Board said the retired share of the U.S. population was almost 1.5 percentage points higher in October 2022 than it was pre-pandemic, “accounting nearly all of the shortfall in the labor force participation rate.”
Dresser said those retirements and the state’s aging population are a major contributor to the declining labor force trends.
“One of the things that’s going on in the background is Wisconsin’s getting older and relatively older compared to the United States, which is also getting older,” she said. “(But) we’re getting older, faster.”

Wisconsin Public Radio, © Copyright 2026, Board of Regents of the University of Wisconsin System and Wisconsin Educational Communications Board.