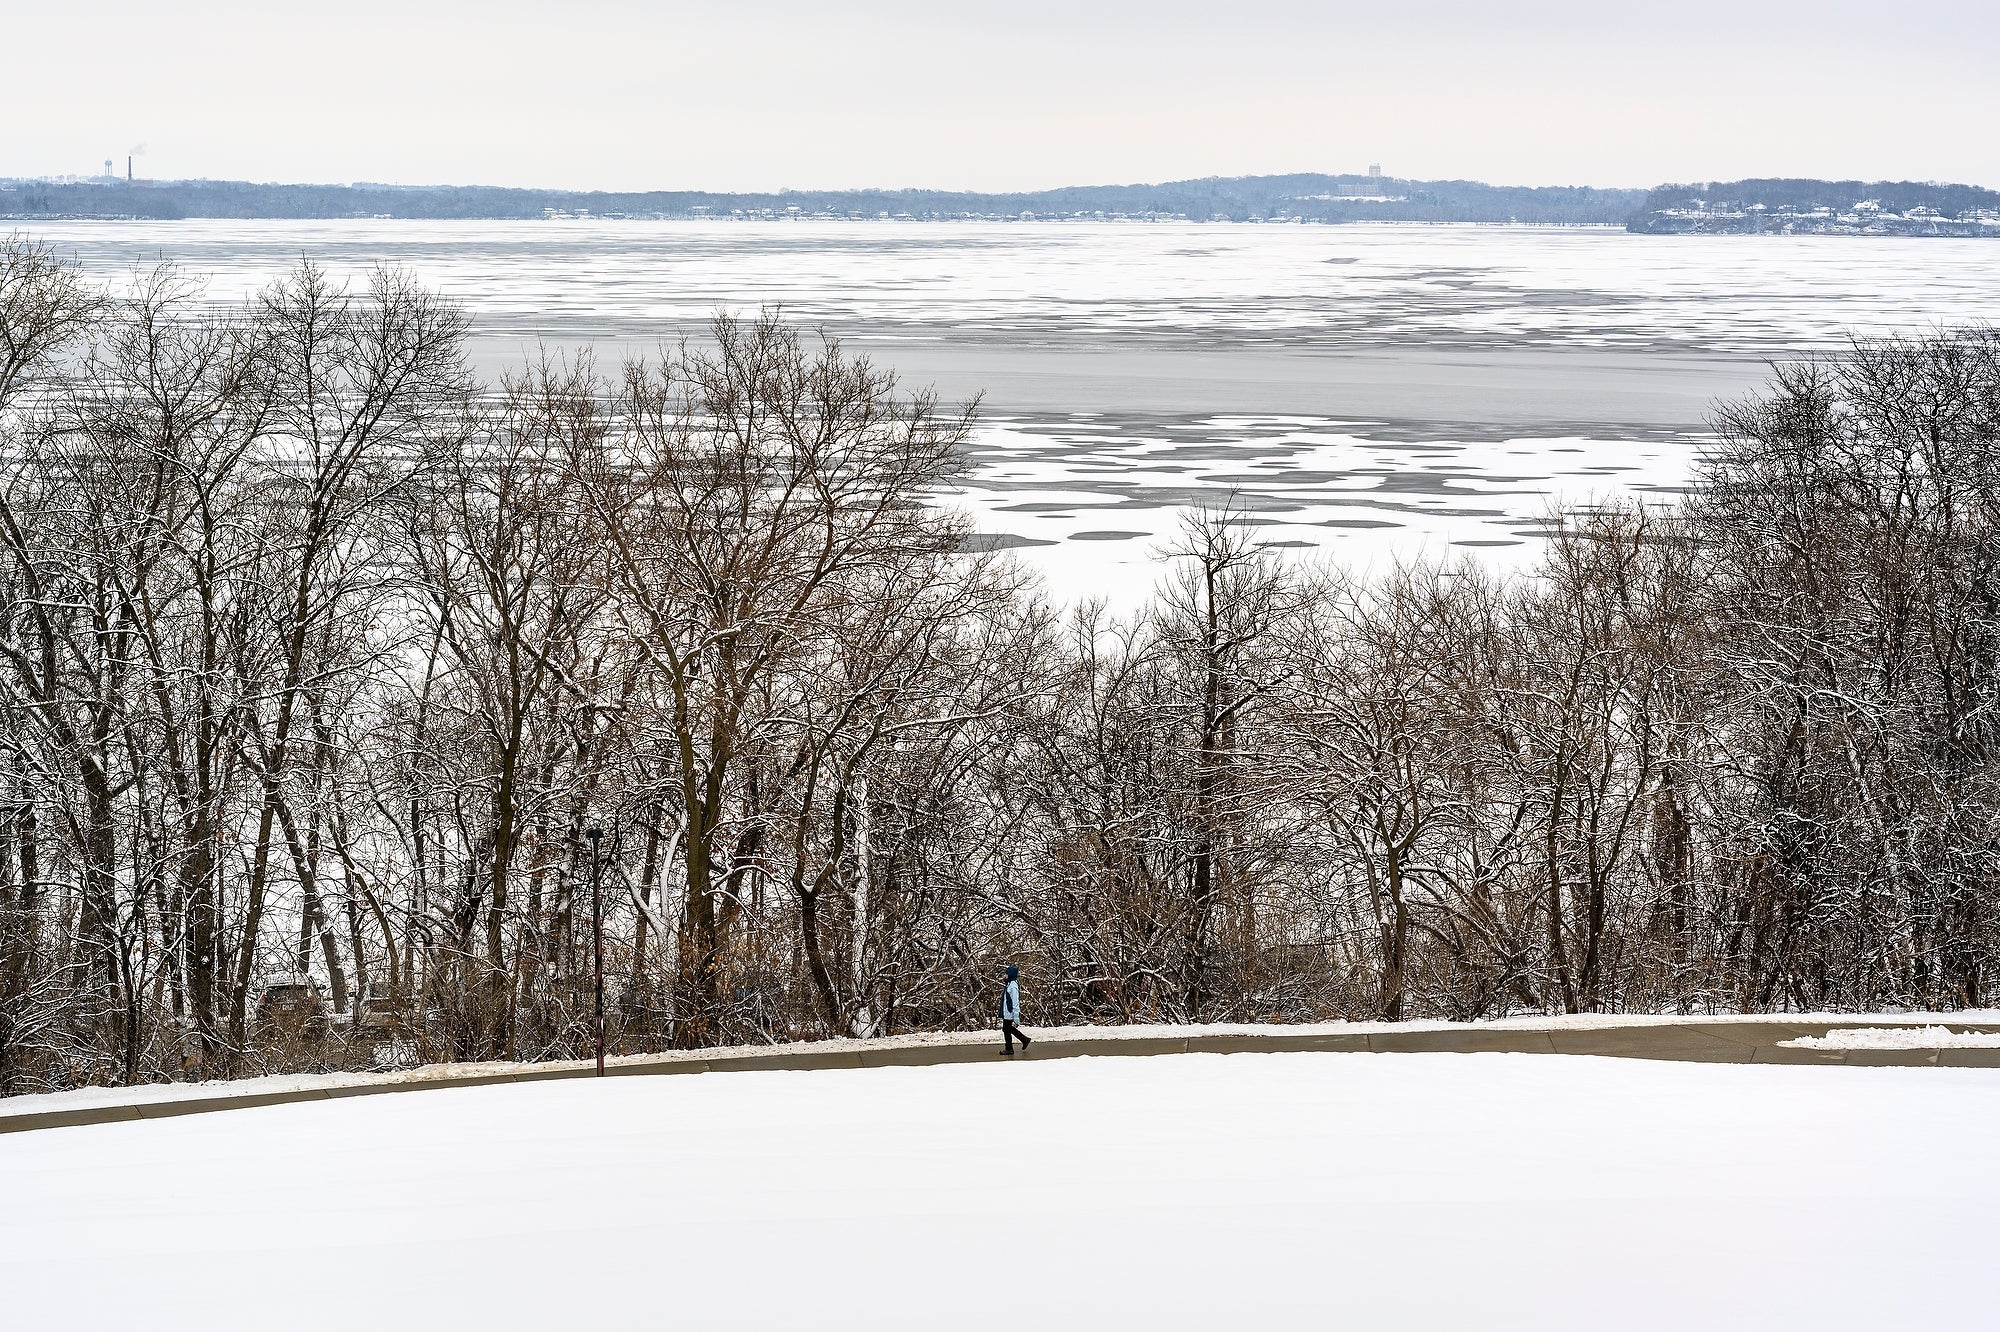
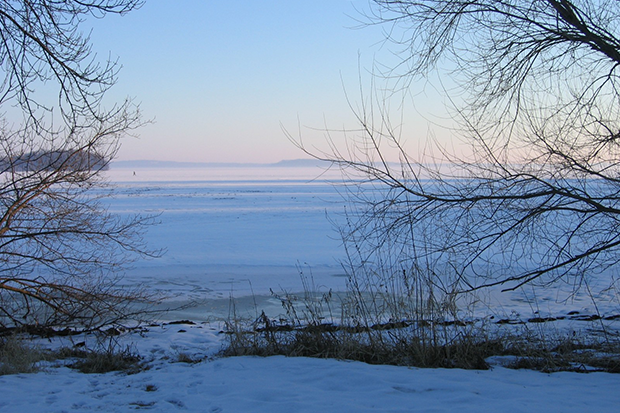
Whether looking forward to ice fishing season, crossing fingers for a rare journey to Lake Superior’s sea caves on the shores of Bayfield County or just enduring the long cold months of winter, chances are the dates that lakes freeze and thaw are one mark by which one can measure the season in Wisconsin.
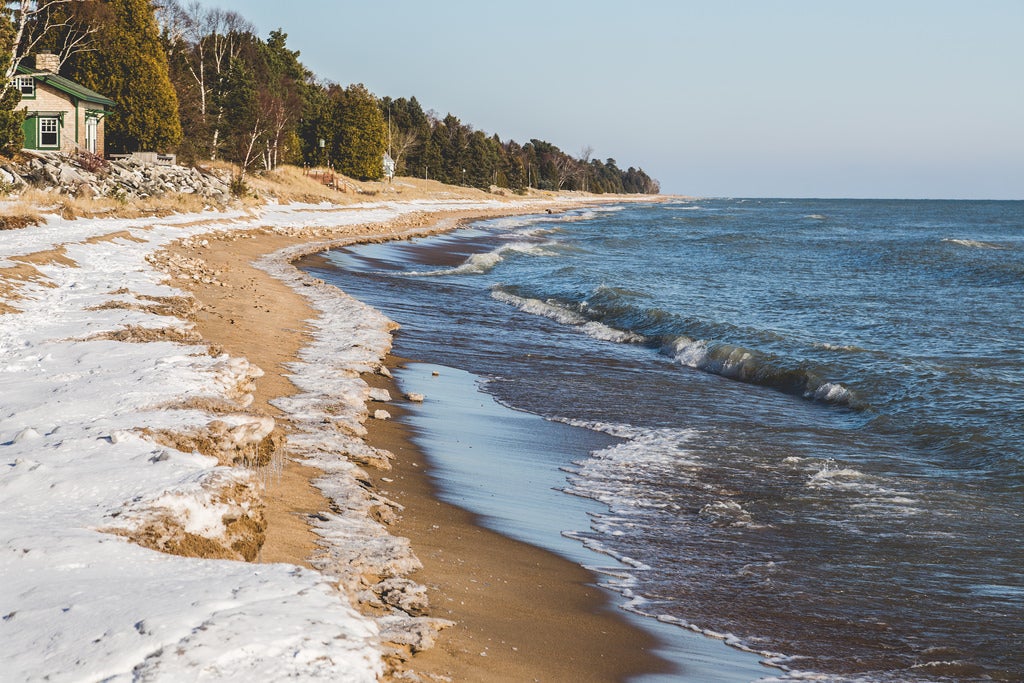
Ice on Wisconsin’s thousands of inland lakes (and along its Lake Michigan and Lake Superior shores) can also serve as a seasonal reminder for how the weather phenomenon known as the El Niño-Southern Oscillation (ENSO) plays out across the state. Driven by changing sea-surface temperatures and trade winds in the tropical Pacific Ocean, ENSO tends to bring the Midwestern U.S. warmer winters during a strong El Niño cycle and typically colder winters during both strong La Niña and ENSO-neutral cycles.
Climatologists and citizen scientists have gathered decades’ worth of data about ice durations at several lakes around Wisconsin. This work captures the number of days between “ice on,” the date of a lake’s first freeze, and “ice off,” the date when the water is thawed enough for a boat to travel from the deepest part of that lake to any shore without encountering ice. This visualization shows how ice durations for six Wisconsin lakes varied over two strong El Niño years, two strong La Niña years, and two ENSO-neutral years.
Stay informed on the latest news
Sign up for WPR’s email newsletter.
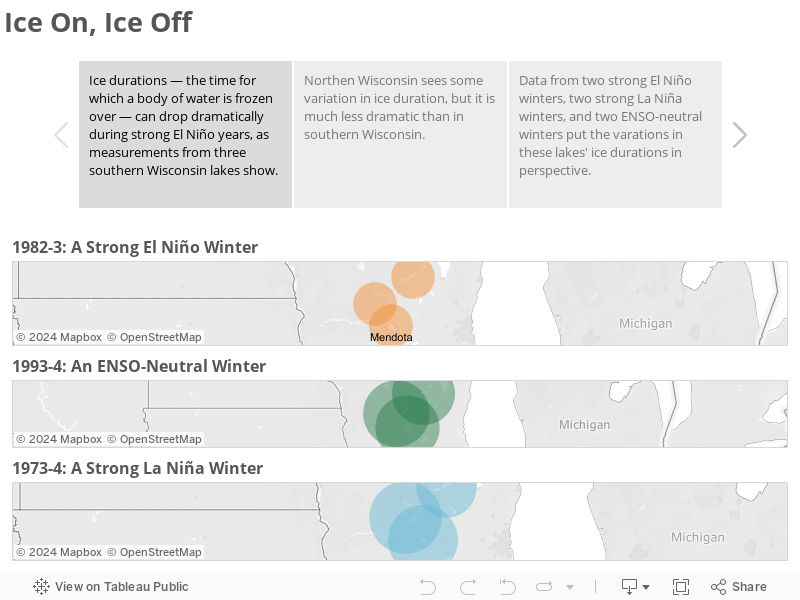
Lake Mendota, in Dane County, had dramatically below-average ice durations in the big El Niño winters of 1982-1983 and 1997-1998 — 54 days and 47 days, respectively, compared with its 50-year average of about 93 days. But its lowest-ever recorded ice duration of 21 days came during the record-setting mild winter of 2001-2002. That was an overall ENSO-neutral year, offering some El Niño effects but also bursts of La Niña activity, in a cycle that charts as fairly moderate compared to those in 1982-1983 and 1997-1998.
Data from northern Wisconsin’s lakes not only reinforce how this region of the state is generally colder, but also show less of a tendency toward ENSO-driven lake ice variations.
Take Trout Lake, located north of Minocqua in Vilas County. Its average ice duration over the past 50 years has been about 134 days, and it doesn’t often make dramatic swings away from that length of time. In one strong El Niño winter, 1982-1983, it froze for an above-average 141 days, and in another, 1997-1998, it went down to 111 — a drop, but not as noticeable as Lake Mendota freezing for just half its average duration that same winter. Trout Lake did feel that warm 2001-2002 winter, freezing for just 78 days, but there’s no other swing anywhere near that dramatic in all the years for which data are available.
For the sake of geographic diversity, this visualization covers three lakes in the southern part of the state and three up north, including Lake Superior at Bayfield. (Surprisingly little data are available on ice durations for lakes in central Wisconsin.) Their ice durations show that ENSO can and does have an impact, but one that’s not easily reduced to simple comparisons. Nor does it make it easy to predict how the stronger El Niño of 2015 will affect the ice cover on Wisconsin’s lakes.
Regional Variations
As is always the case with ENSO, no two years are exactly the same, and the effects can be quite different in different areas of the state.
“The bottom line from my perspective is the influence of El Niño on (ice) breakup dates of lakes is real, and it occurs on lakes around the Northern Hemisphere,” said John Magnuson, a University of Wisconsin-Madison emeritus professor of zoology and limnology. “You can’t always predict it well … but I wouldn’t pooh-pooh it too much.”
Magnuson is a member of the UW-Madison Center for Limnology research project, the North Temperate Lakes Long-Term Ecological Research (NTL-LTER) group, that gathers the lake-ice data used in this presentation. In fact, the NTL-LTER data set, stretching back about 150 years and covering one group of lakes in southern Wisconsin and another in northern Wisconsin, is among the most extensive lake-ice data sets anywhere in the world — and for Magnuson, that highlights how much is unknown about the causes of weather variations.
“You need really long series (of data) to tease out, in any statistically valid sense, things like ENSO,” Magnuson said. Even though Magnuson’s own research argues that ENSO does affect ice on lakes, there’s always the caveat that so many other factors, from climate change to all manner of short- and long-term weather oscillations to complete unknowns, are constantly interacting. “They’re all happening, and they’re additive, or subtractive,” he said.
Magnuson points out how many other factors influence lake freeze and thaw dates, from how sunny it is to whether an El Niño is particularly strong in a month when a given lake already has a tendency to start thawing. Additionally, southern Wisconsin’s lakes are really just barely in the part of the country where lakes freeze at all, and tend to have thinner ice in the first place.
Fluctuations in Wisconsin’s lake freezes also serve as a reminder that El Niño, despite being a major climatic force affecting weather around the globe, doesn’t operate in a vacuum. Working from the same lake-ice data cited in this story, the Climate Wisconsin project showed that Lake Mendota and its Madison neighbor Lake Monona have recently been experiencing generally shorter freezes than they did in the mid- to late-19th century, highlighting a localized signal of long-term climate change. For Lake Mendota, the project shows, all 10 of the longest freezes on record happened before 1900, and seven of the 10 shortest occurred after 1960.
This report was produced in a partnership between Wisconsin Public Radio, PBS Wisconsin and the University of Wisconsin Cooperative Extension. @ Copyright 2024, Board of Regents of the University of Wisconsin System and Wisconsin Educational Communications Board.