
At a glance, Wisconsin’s legislative district maps in place since 2011 don’t reveal districts with the bizarre shapes and outlines that are classic markers of gerrymandering schemes. But a closer examination of the state Assembly districts reveals a more sophisticated approach to this electoral stratagem, particularly in the sharp red-blue divide that spans Milwaukee and its suburbs.
Gerrymandering is the practice of intentionally manipulating the boundaries of legislative districts to achieve a desired political end. Given the increasingly partisan voting practices of elected officials in Wisconsin and more broadly across the United States, manipulation of districts to give one political party an advantage leaves voters who support other parties’ candidates without meaningful representation, depriving them of a voice in representative government.
News with a little more humanity
WPR’s “Wisconsin Today” newsletter keeps you connected to the state you love without feeling overwhelmed. No paywall. No agenda. No corporate filter.
Claims of unconstitutional gerrymandering in Wisconsin is at the heart of an historic lawsuit before the U.S. Supreme Court. The plaintiffs in Gill v. Whitford, which was argued before the high court on Oct. 3, 2017, contend that the state’s legislative district map adopted in 2011 exemplifies partisan gerrymandering that deprives them of their rights to representation under the legal concept of “one person, one vote” and is therefore unconstitutional.
Every ten years, as mandated by the U.S. Constitution, a complete count of all the people in the nation is taken. The most basic goal of the decennial count by the U.S. Census Bureau is to update the government’s information on the number of people living at every address around the country. These counts are used for a number of purposes, including setting state and local funding levels, and planning public works investments. Primary among the Census’ purposes is to maintain equal representation at all levels of government. Over time, some places grow in population, while others shrink. The Census data are used as the fundamental building block for redrawing political districts every decade to ensure that each person is equally represented in government.
The redistricting process varies by state, and there can be significant differences between them. In Wisconsin, as in 36 other states, the state legislature has control of the process. The district map is revised following the release of Census population counts, and the revised map is is considered and voted upon like any other legislation, requiring a majority vote in both legislative chambers and the governor’s signature. Thus, if a political party holds power in the year following the decennial census, it controls the effort to redraw legislative boundaries. Following the 2010 election — and that year’s Census — Republicans held majorities in the Wisconsin Assembly and Senate, as well as the governorship, putting them in the driver’s seat to control that round of redistricting.
The goal of the redistricting process is to ensure that each seat in all state legislative bodies represents approximately the same number of people. However, when the process is controlled by a partisan majority, a secondary goal may enter the picture: maintaining or increasing that majority. Districts may be intentionally redrawn in ways that make it easier for candidates from the party drawing the maps to win future elections. In order to prevent this possibility, advocates of non-partisan control of the redistricting process are seeking to implement this approach across the nation, including in Wisconsin. Five states already use independent commissions comprised of neither legislators nor public officials to redraw their maps, which tend to produce tighter races and more competitive elections.
District mapmakers — whomever they are — do have to follow some rules and guidelines. The federal government requires that in all 50 states, legislative districts in must have roughly equal total population. In practice, district populations end up being within a range of about 10 percent of each other. Additionally, the Voting Rights Act of 1965 prohibits the drawing of districts in such a way as to to deny racial minorities meaningful participation in the political process.
In Wisconsin, the state constitution sets four other requirements for redistricting. For starters, it specifies that districts should be compact. This requirement is meant to prevent a familiar form of gerrymandering, which gets its name from a cartoon lampooning an 1812 Massachusetts district with an especially bizarre shape resembling a mythical salamander.
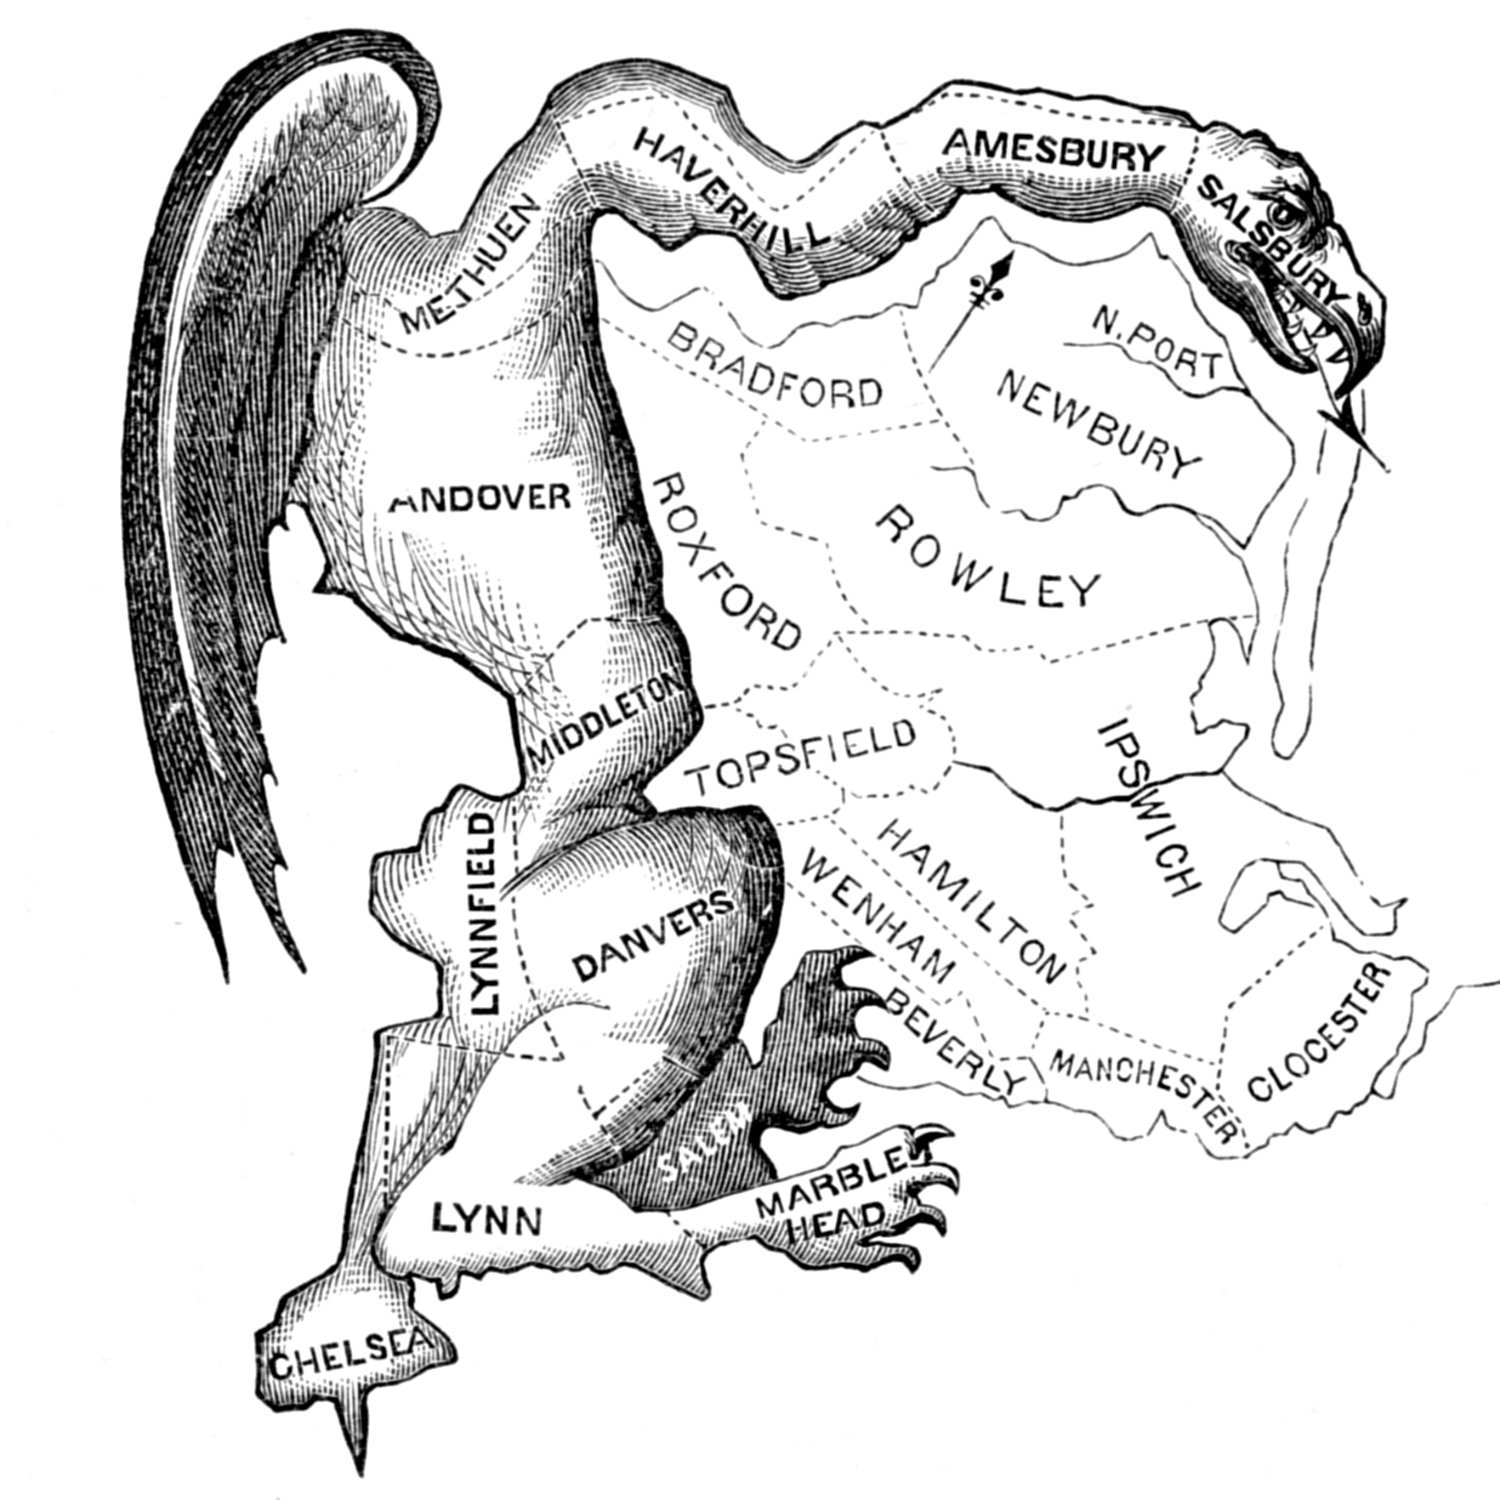
The term “gerrymandering” was coined in 1812, following the creation of a legislative district resembling a mythological salamander under Massachusetts Gov. Elbridge Gerry.
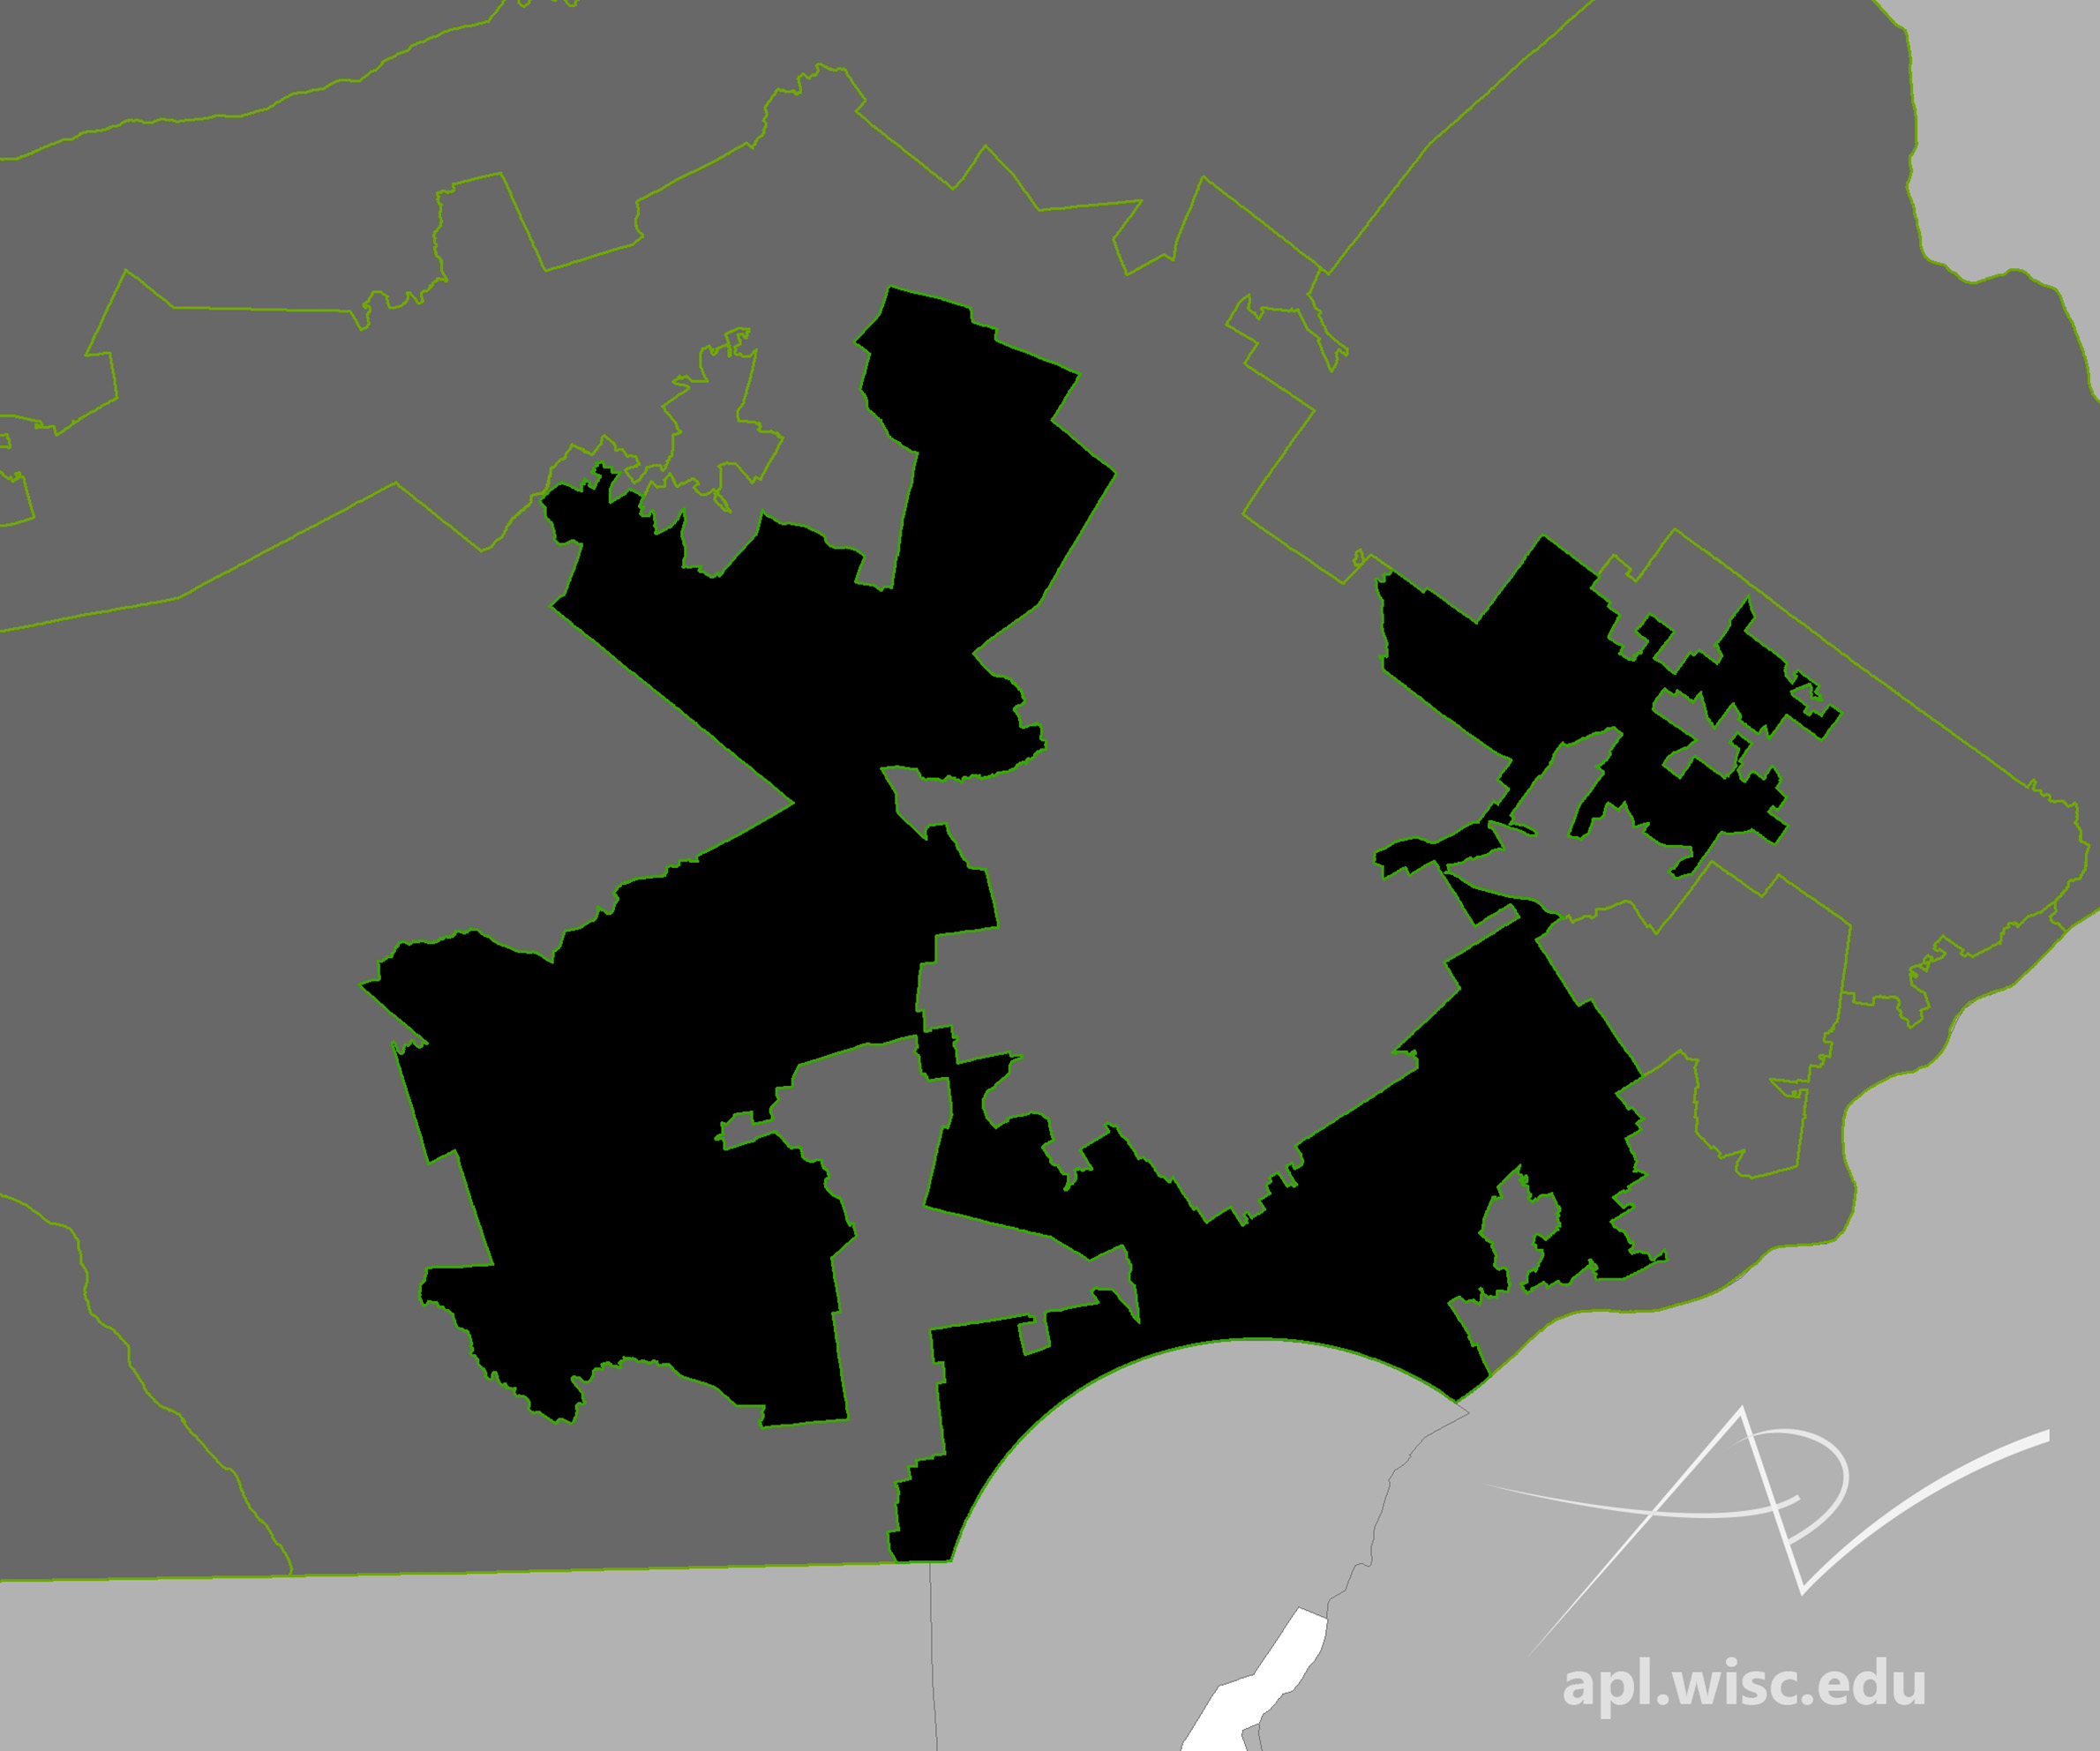
A compactness rule also exists in Pennsylvania, and was at the forefront in February 2018, when that state’s Supreme Court decided on a lawsuit arguing that its 2011 legislative maps were a partisan gerrymander. For example, Pennsylvania’s 7th congressional district, often described as a silhouette of Goofy kicking Donald Duck, received attention as an egregious example of where the compactness rule has been violated. The state high court overturned the 2011 district map, ruling that it was indeed a partisan gerrymander, in part based on violation of the compactness rule, and ordered the drawing of new districts.
The state constitution specifies three additional requirements that are intended to keep communities together in terms of representation in government. It states specifically that districts should maintain the integrity of communities of interest — usually defined simply as groups of people who have similar legislative concerns — and requires that districts be bounded by county, precinct, town or ward lines. Finally, each district must be contiguous — that is, its parts must be attached to one another.
Some exceptions to the contiguity rule apply. For example, the city of Racine has a non-contiguous area due to a 1964 annexation of land from the town of Mount Pleasant; it’s separated from the rest of the city area by the Root River and unincorporated areas. In such cases, Wisconsin’s rules allow a legislative district to follow another administrative boundary, even if it is non-contiguous, in order to preserve the community’s representation by a single elected official. Likewise, Washington Island at the tip of the Door County peninsula is included in the district that covers the peninsula across the Porte de Morts passage.
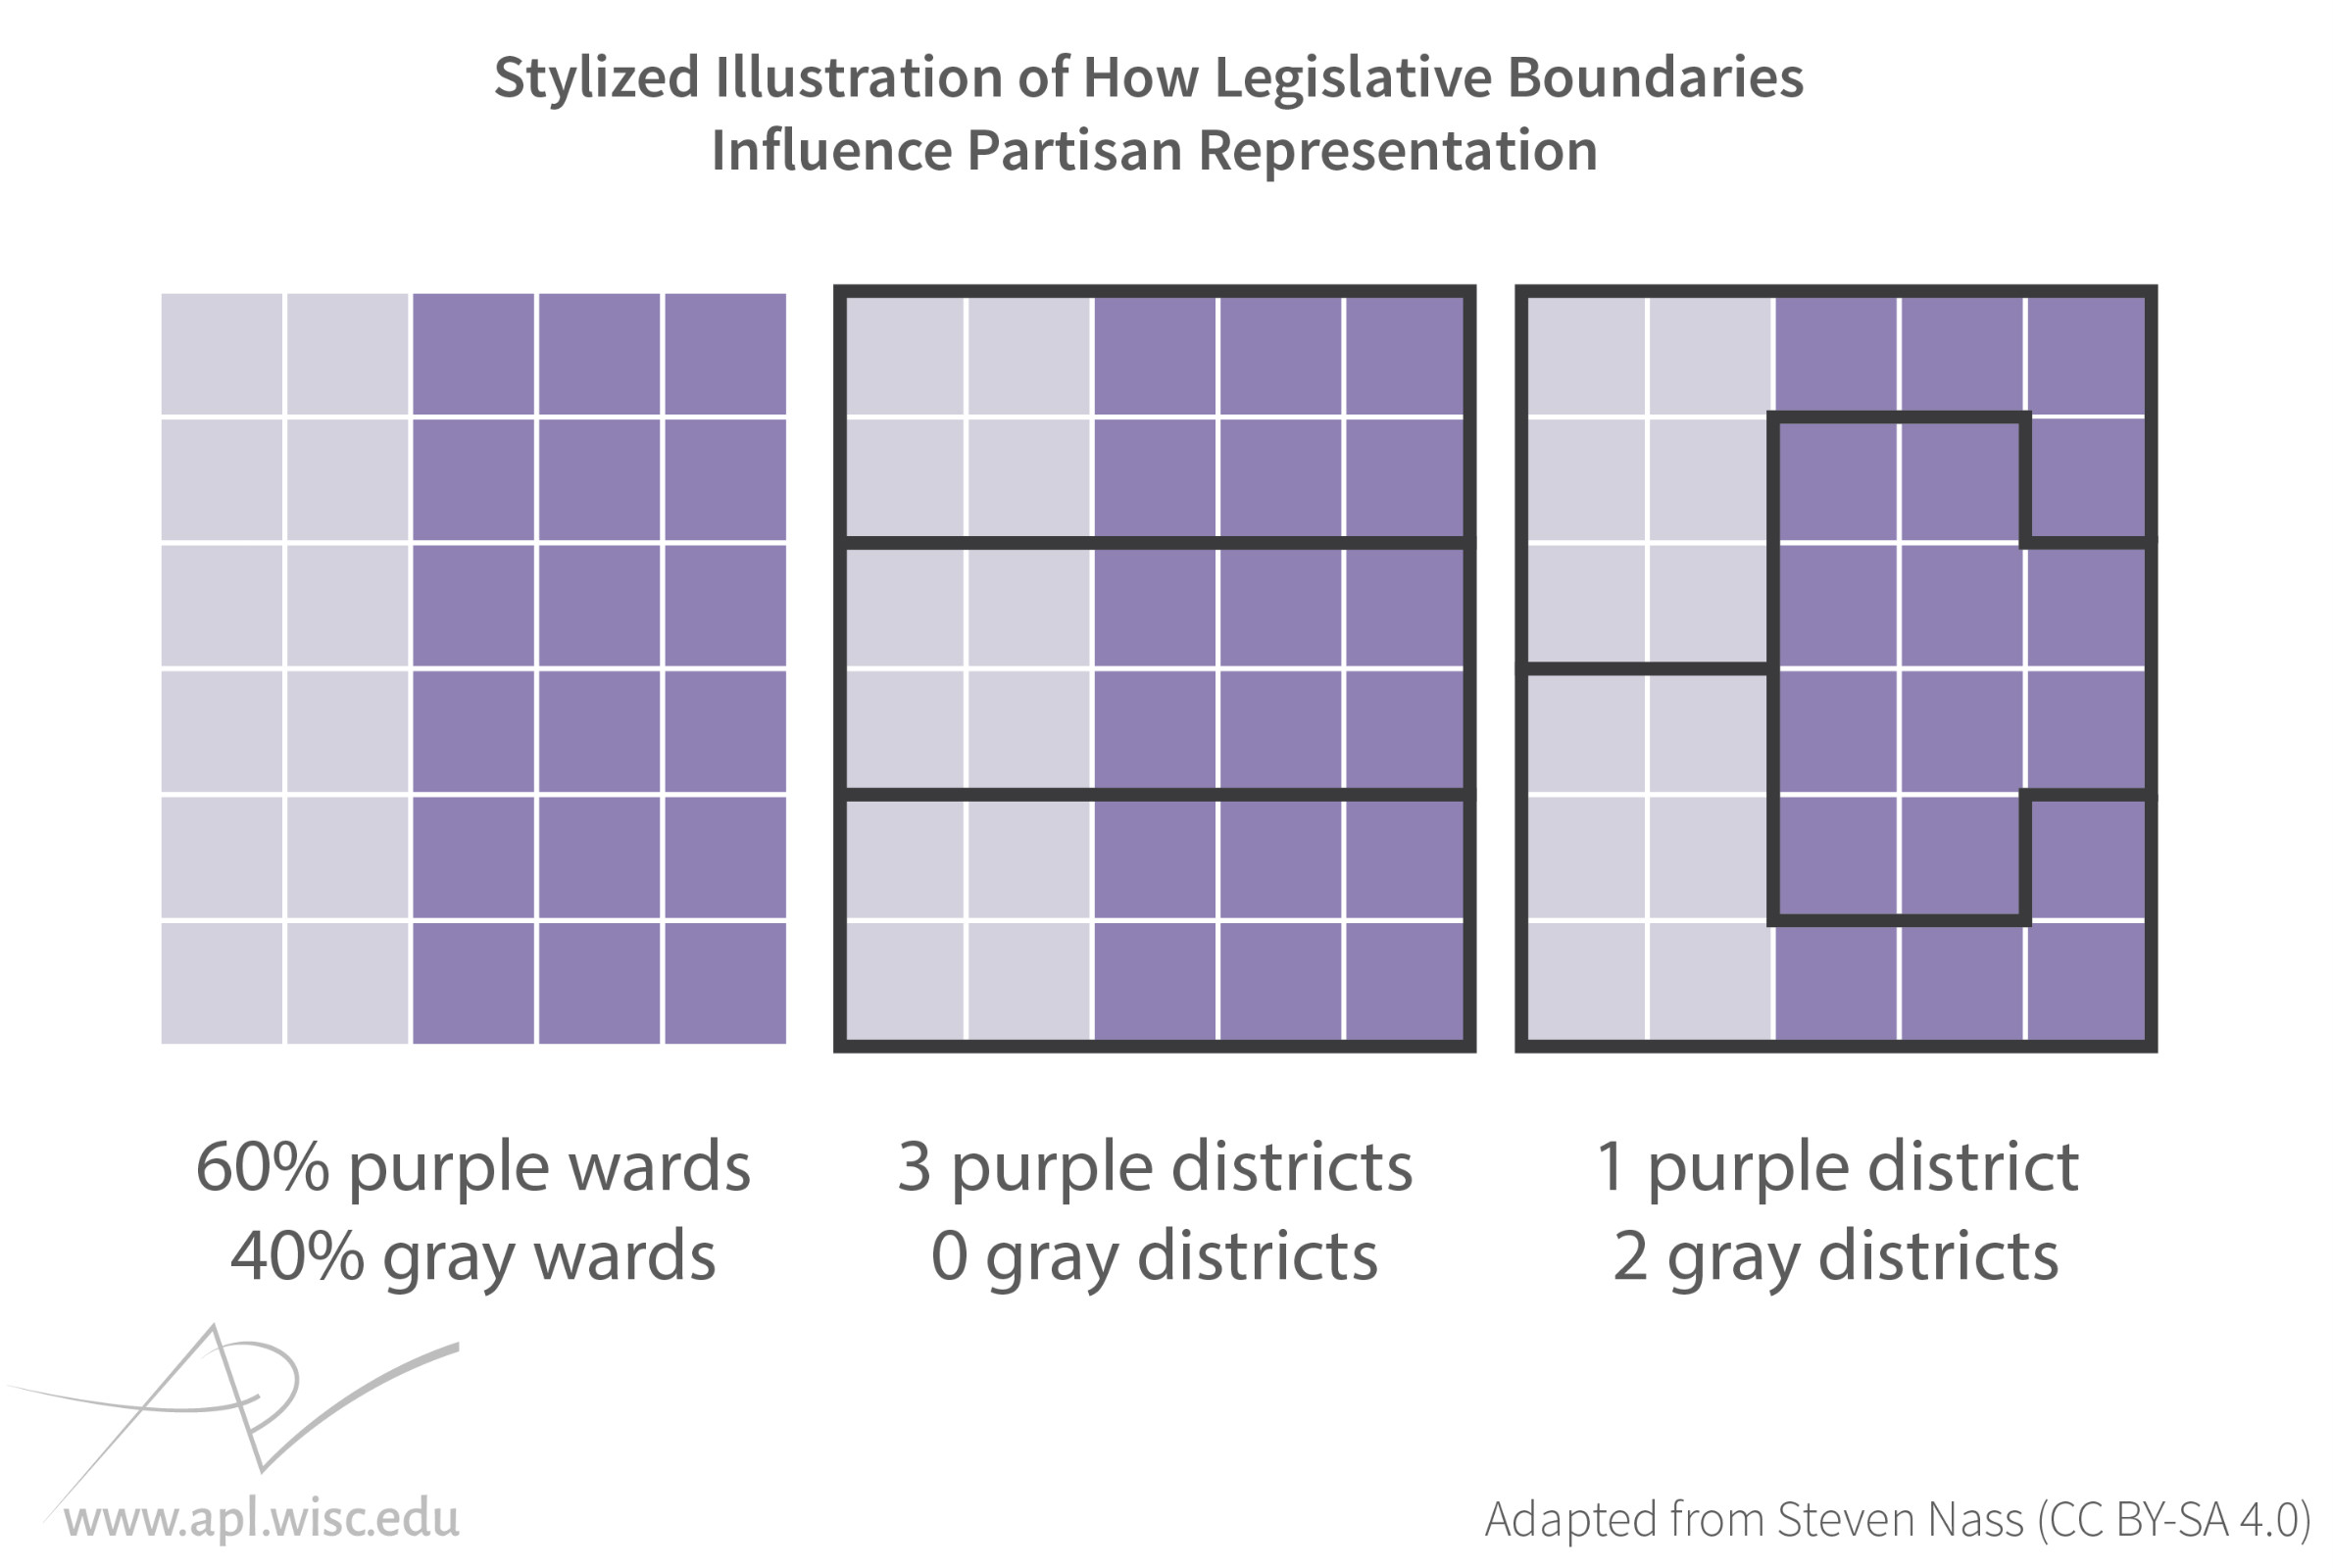
Two core concepts of gerrymandering were central to the arguments presented to the high court: cracking and packing. A third process, known as stacking, also crops up in gerrymandered political maps, but was not the focus of Gill. v. Whitford.
Cracking and packing both refer to specific ways of drawing legislative boundaries with the outcomes of elections in mind. These two processes operate in tension with one another, but both can be implemented by a party in power seeking to maximize its electoral chances through gerrymandering.
Packing refers to the practice of drawing particular districts in such a way as to ensure that another party’s candidate wins that seat by a tremendous margin. Although the opposing party is all but guaranteed the seat, packing makes surrounding districts less competitive, and thus tips the balance of power in the legislative body overall toward the ruling party.
Cracking involves drawing districts in such a way as to divide a concentration of specific types of voters across several districts such that they are a minority in each one, with practically no hope of achieving representation in any of the districts. This practice also helps make districts less competitive.
Historically, cracking and packing have been used as tactics by both political parties. In Gill v. Whitford, the plaintiffs argued that the ruling Republican majority in Wisconsin used each of these techniques in the 2011 redistricting process to maintain and bolster its majority in the state Assembly and Senate.
Stacking refers to the practice of creating districts that are evenly split between lower-income, less educated minorities (who by and large vote for Democratic candidates) and higher-income, more educated whites (who are more likely to vote for Republicans). Because the higher-income voters turn out in larger numbers, this approach can also tip the balance of power — because of the dynamics at play, stacking would nearly always favor the conservative-leaning party.
It has always been the case that people vote in relatively predictable ways. Historically, voting behavior in previous elections was used to predict future ballot outcomes and achieve successful gerrymandering. Although the U.S. Census only asks the most basic demographic questions —how many people at each address and their age, sex and race — tremendous quantities of additional data are available from a variety of public and private sources, allowing those who draw the legislative district maps to predict partisan voting outcomes at any geographic scale.
Two more aspects of the U.S. social landscape help make gerrymandering possible.
First, partisan voting is associated with social and economic class. For example, blacks are dramatically more likely to vote for Democrats than whites. Meanwhile, people with higher incomes are much more likely to vote Republicans than those who are poorer.
In addition, voters are not randomly distributed across the landscape. Instead, people live in neighborhoods that are strongly patterned by class, race, education and a host of other social factors — the same factors that predict partisanship and voting. Cracking, packing and stacking are all possible because these patterns exist, and thus, probable voting behavior can be associated with places. Where residents are more clustered by these social factors, gerrymandering is made even easier.
Voting and representation in the Milwaukee metro area
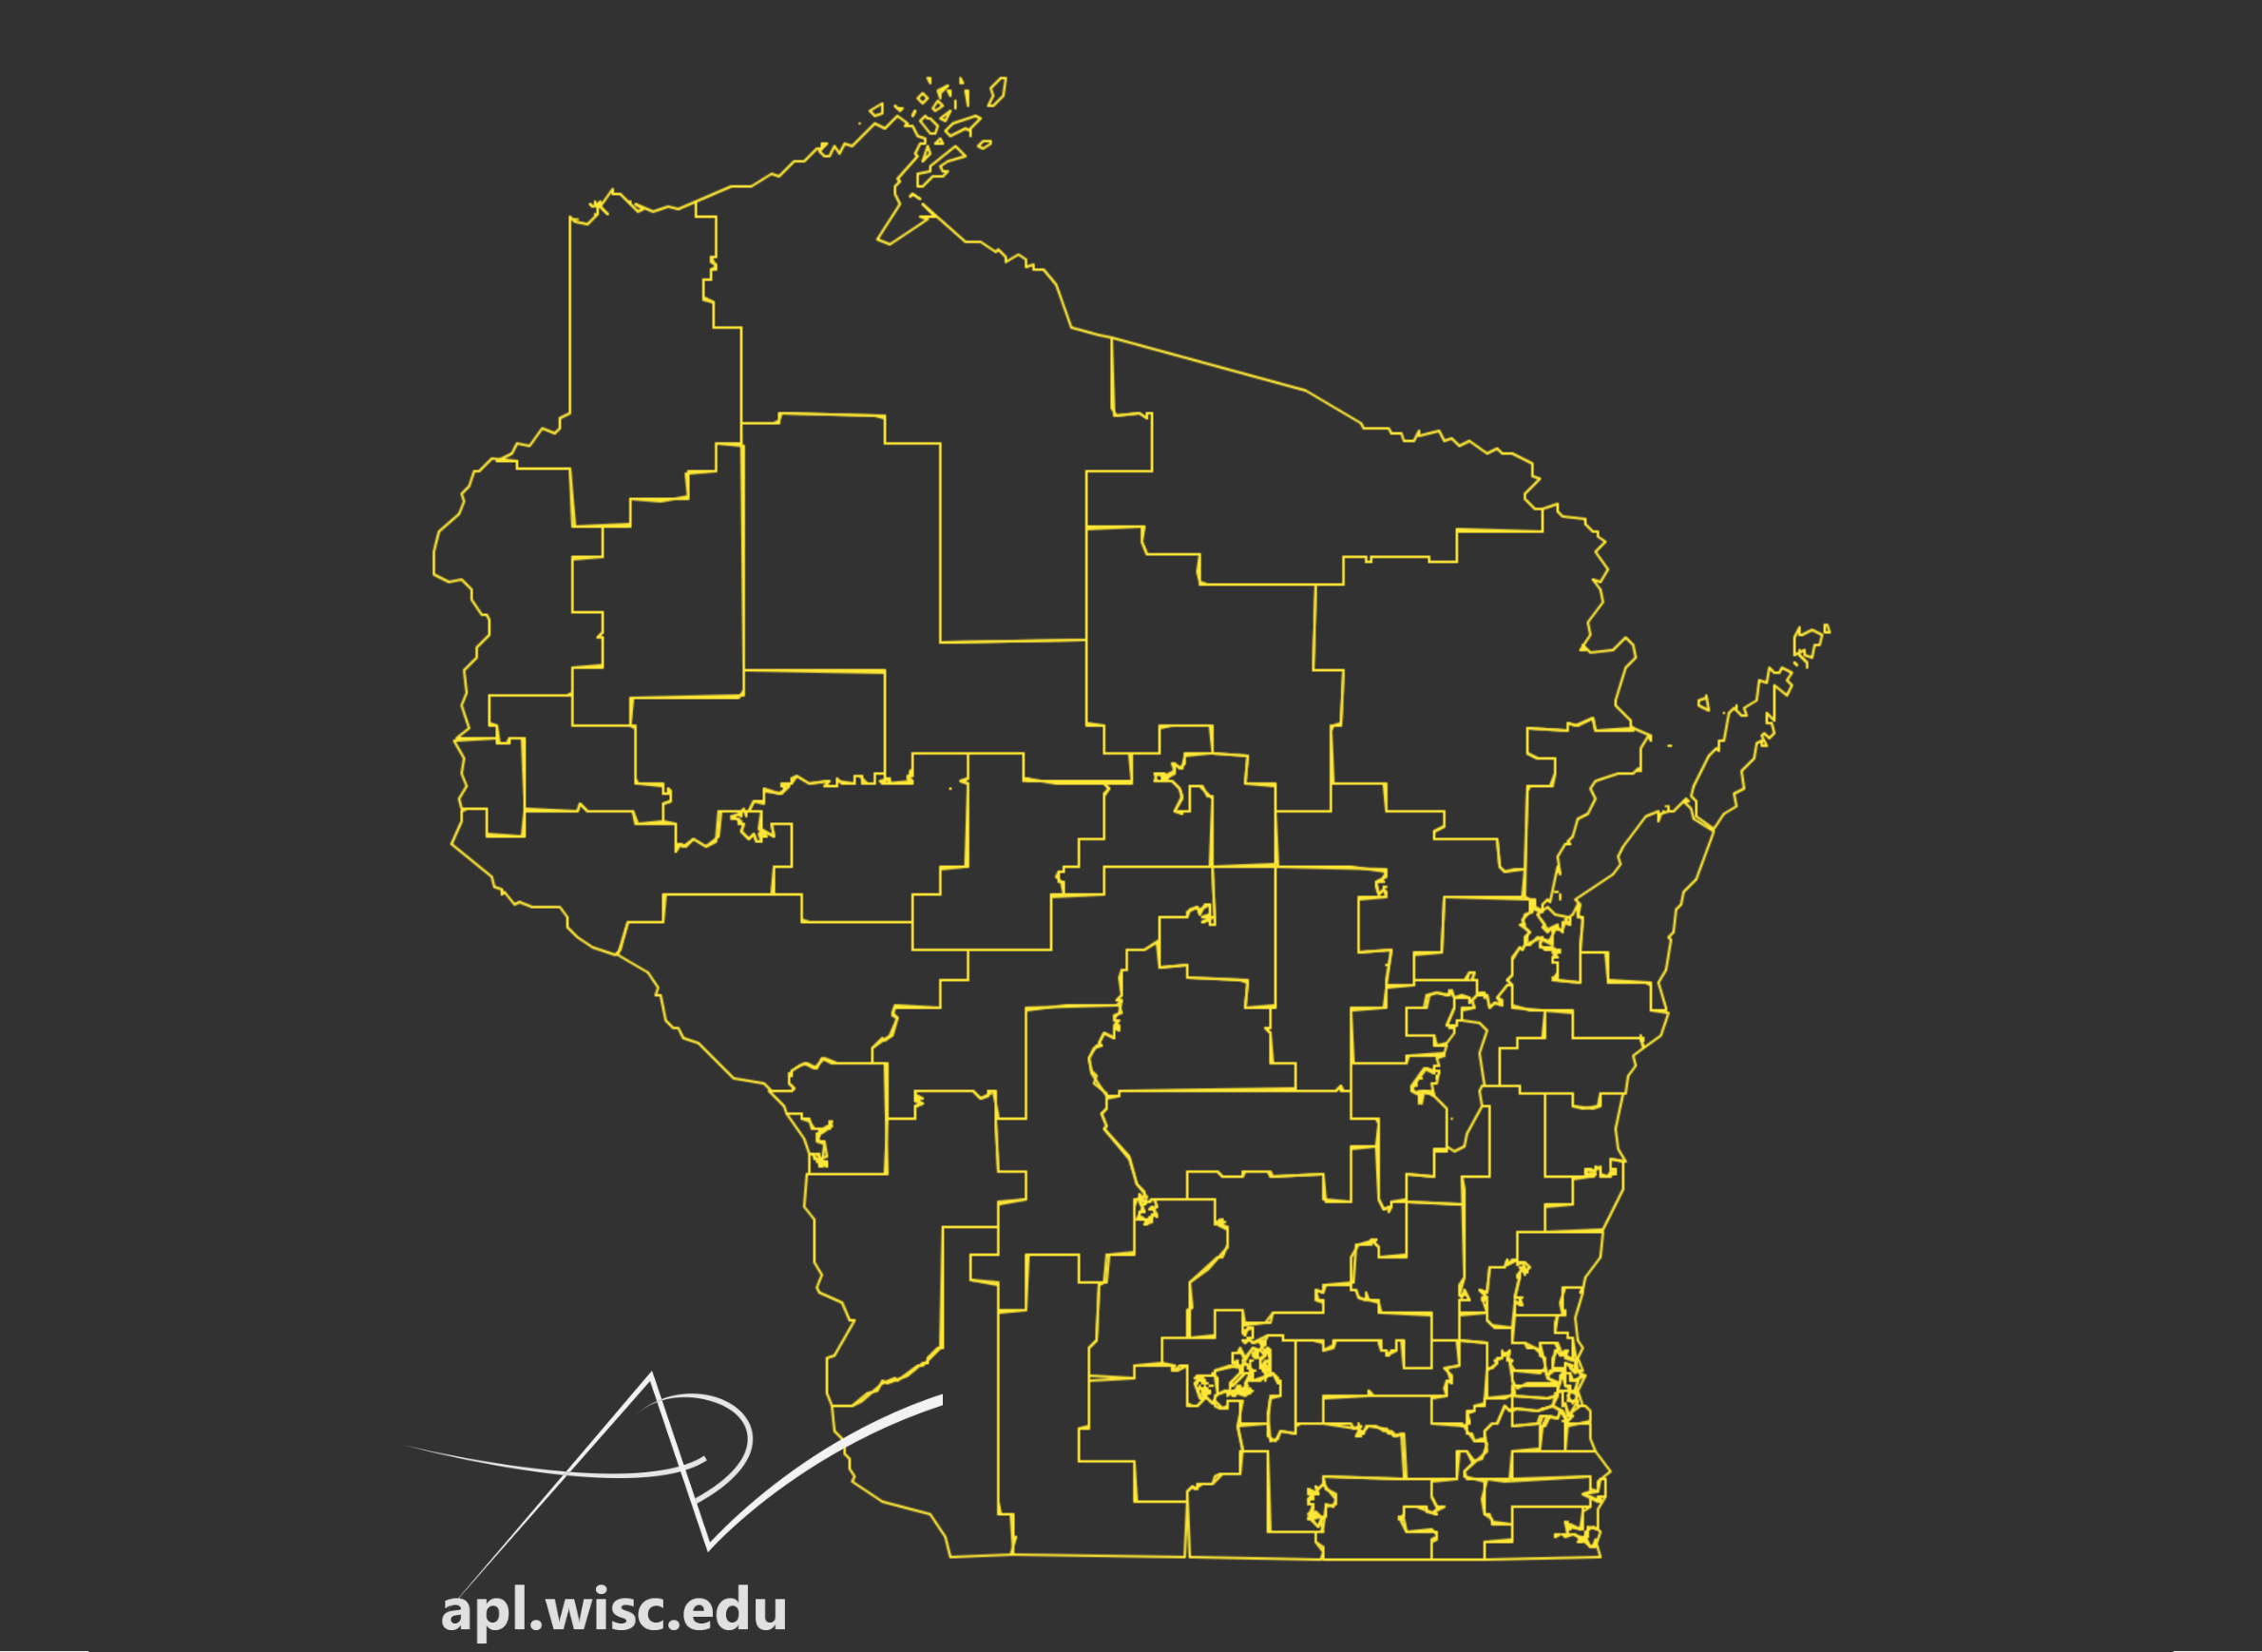
The Wisconsin Assembly district map adopted in 2011 by the state’s Republican-majority Legislature does not jump out as an example of gerrymandering that’s visually distinctive in terms of convoluted and strangely-shaped districts, such as those struck down in Pennsylvania. Instances of both packing and cracking can be observed though.
 Caitlin McKown/UW Applied Population Lab
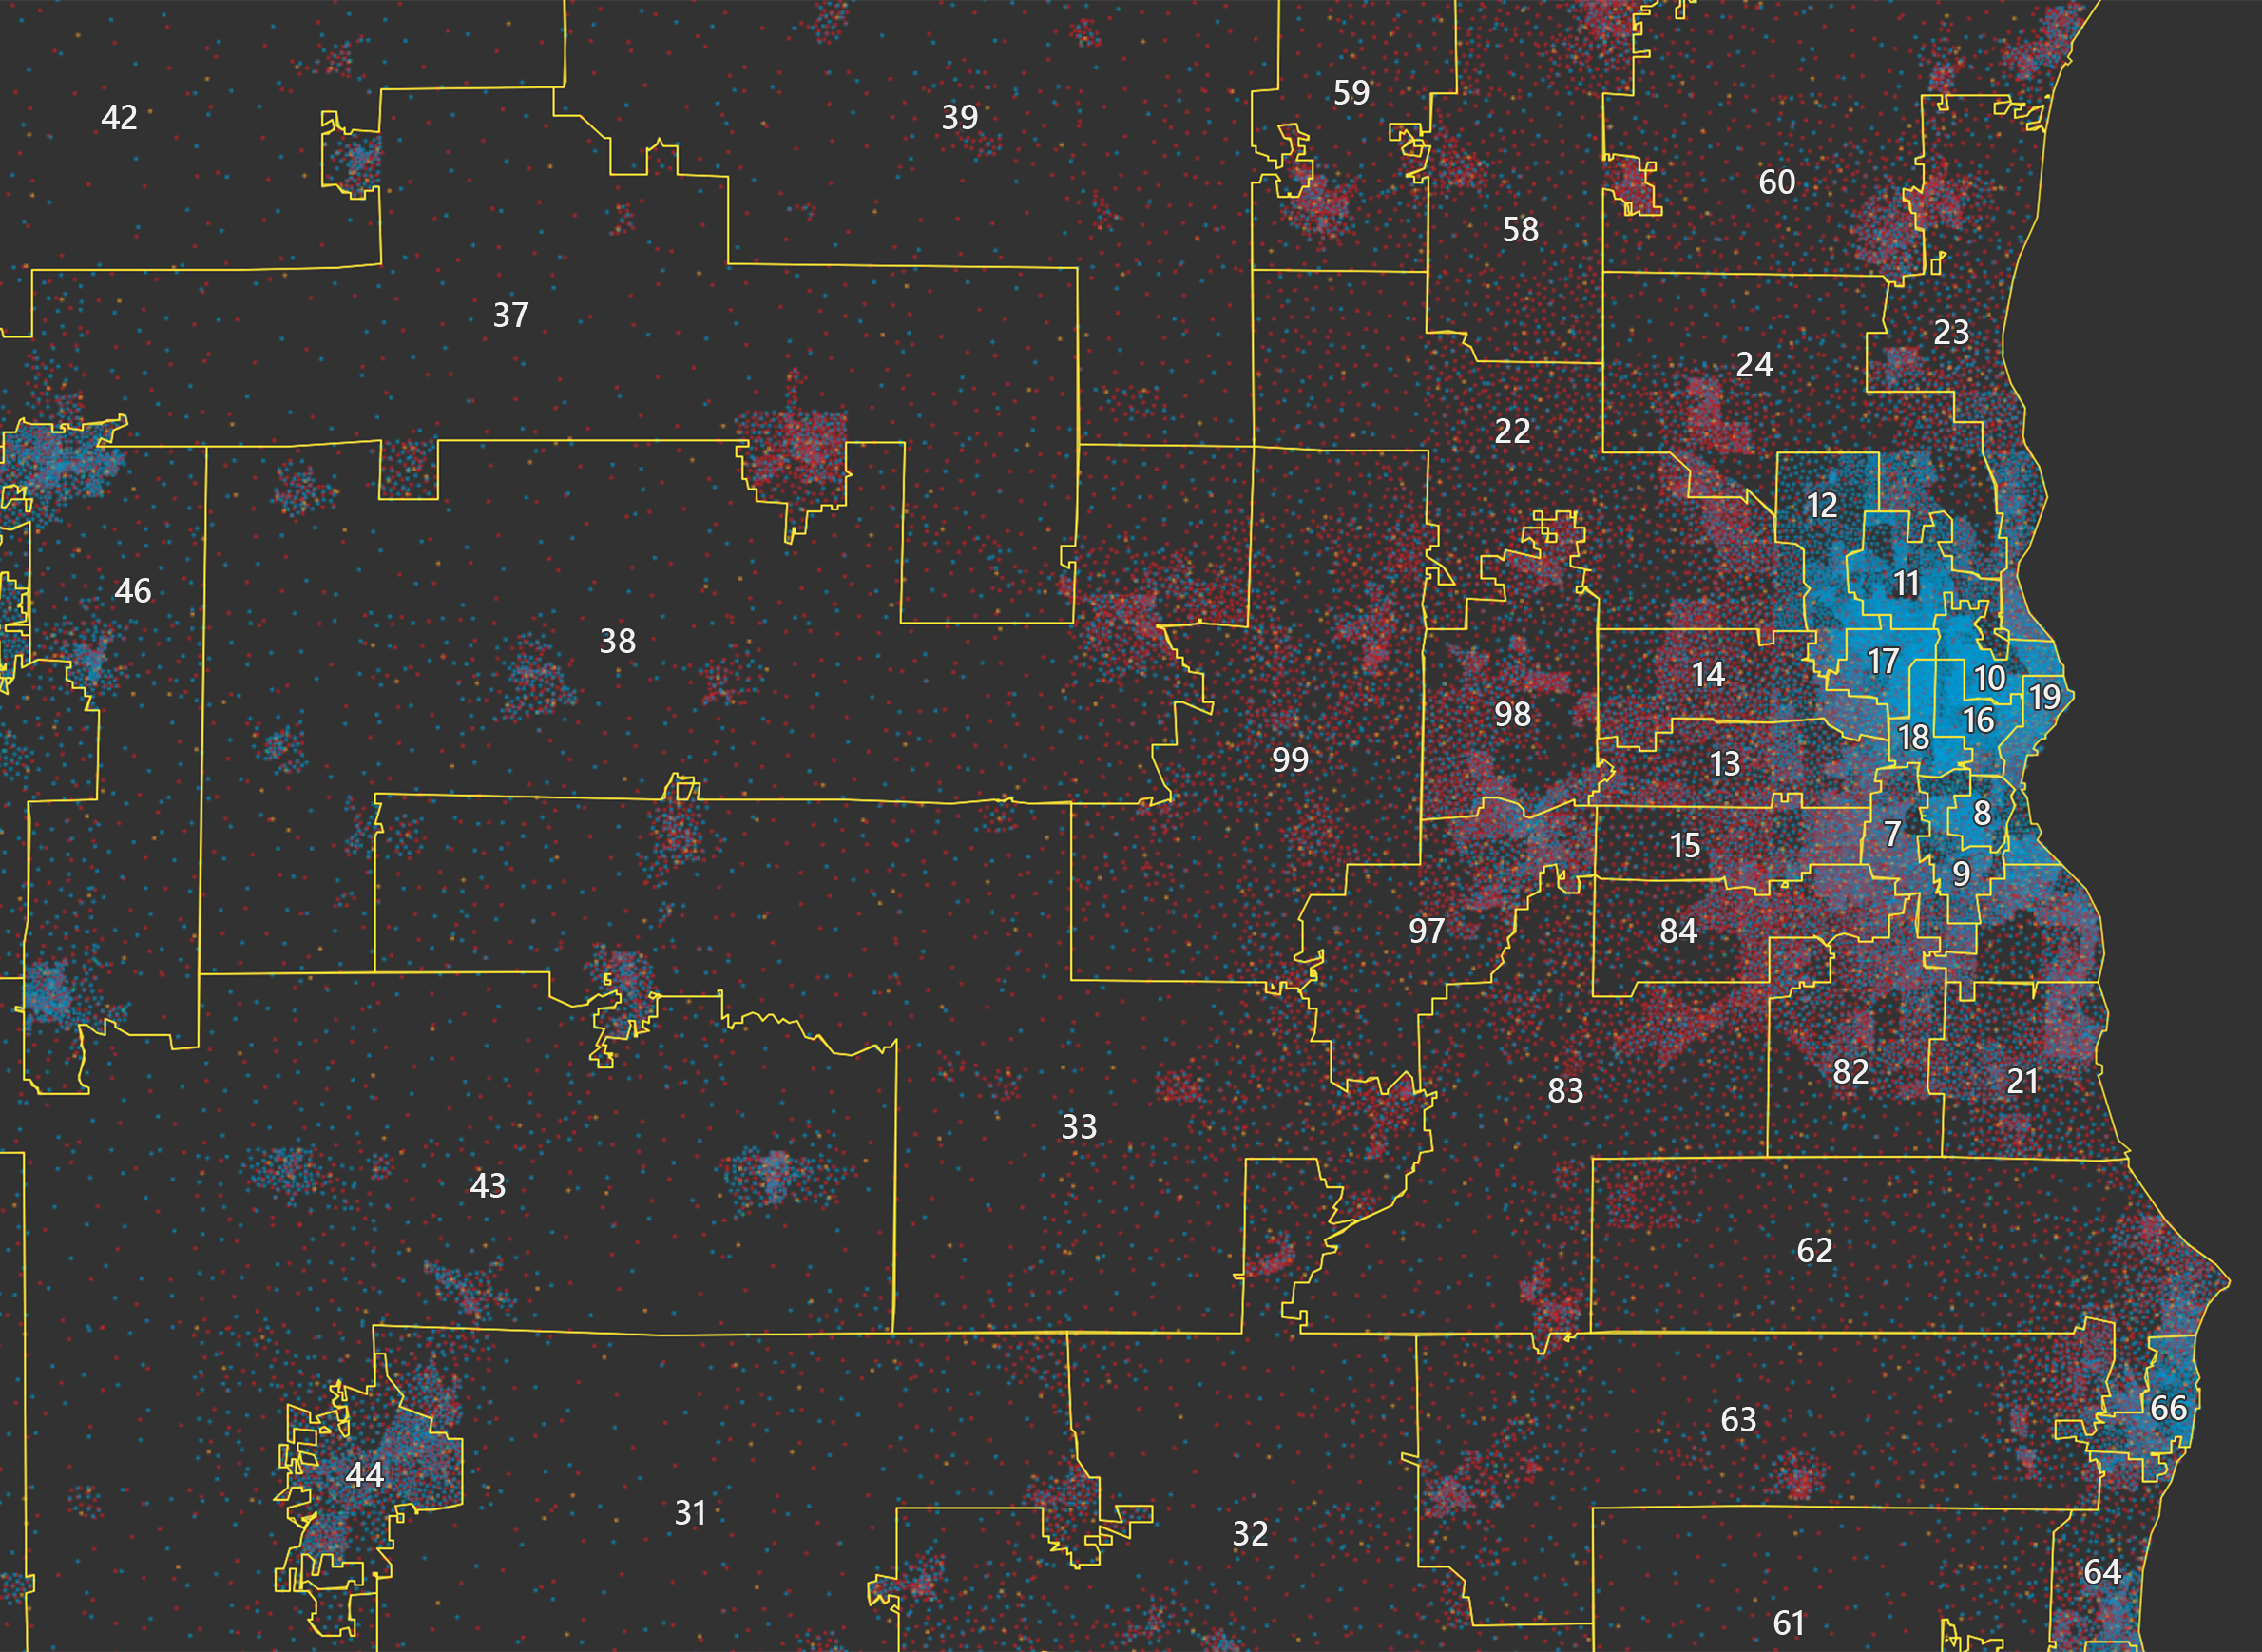
The results of the 2016 presidential election are shown in an interactive map of Wisconsin featuring the 2011 legislative district boundaries, produced by the University of Wisconsin Applied Population Laboratory. Blue dots represents votes for Democratic candidate Hillary Clinton and red dots represents votes for Republican candidate and election victor Donald Trump. Yellow dots represent Libertarian Party candidate Gary Johnson and green dots represent votes for Green Party candidate Jill Stein. Votes for other candidates, which were small in number, are not shown. The Assembly district boundaries are displayed in a white outline.
Zooming in on Milwaukee, several Assembly districts that overlap with the the city have extremely high concentrations of Democratic voters, especially in districts 8, 10, 11, 16, 17, 18 and 19.
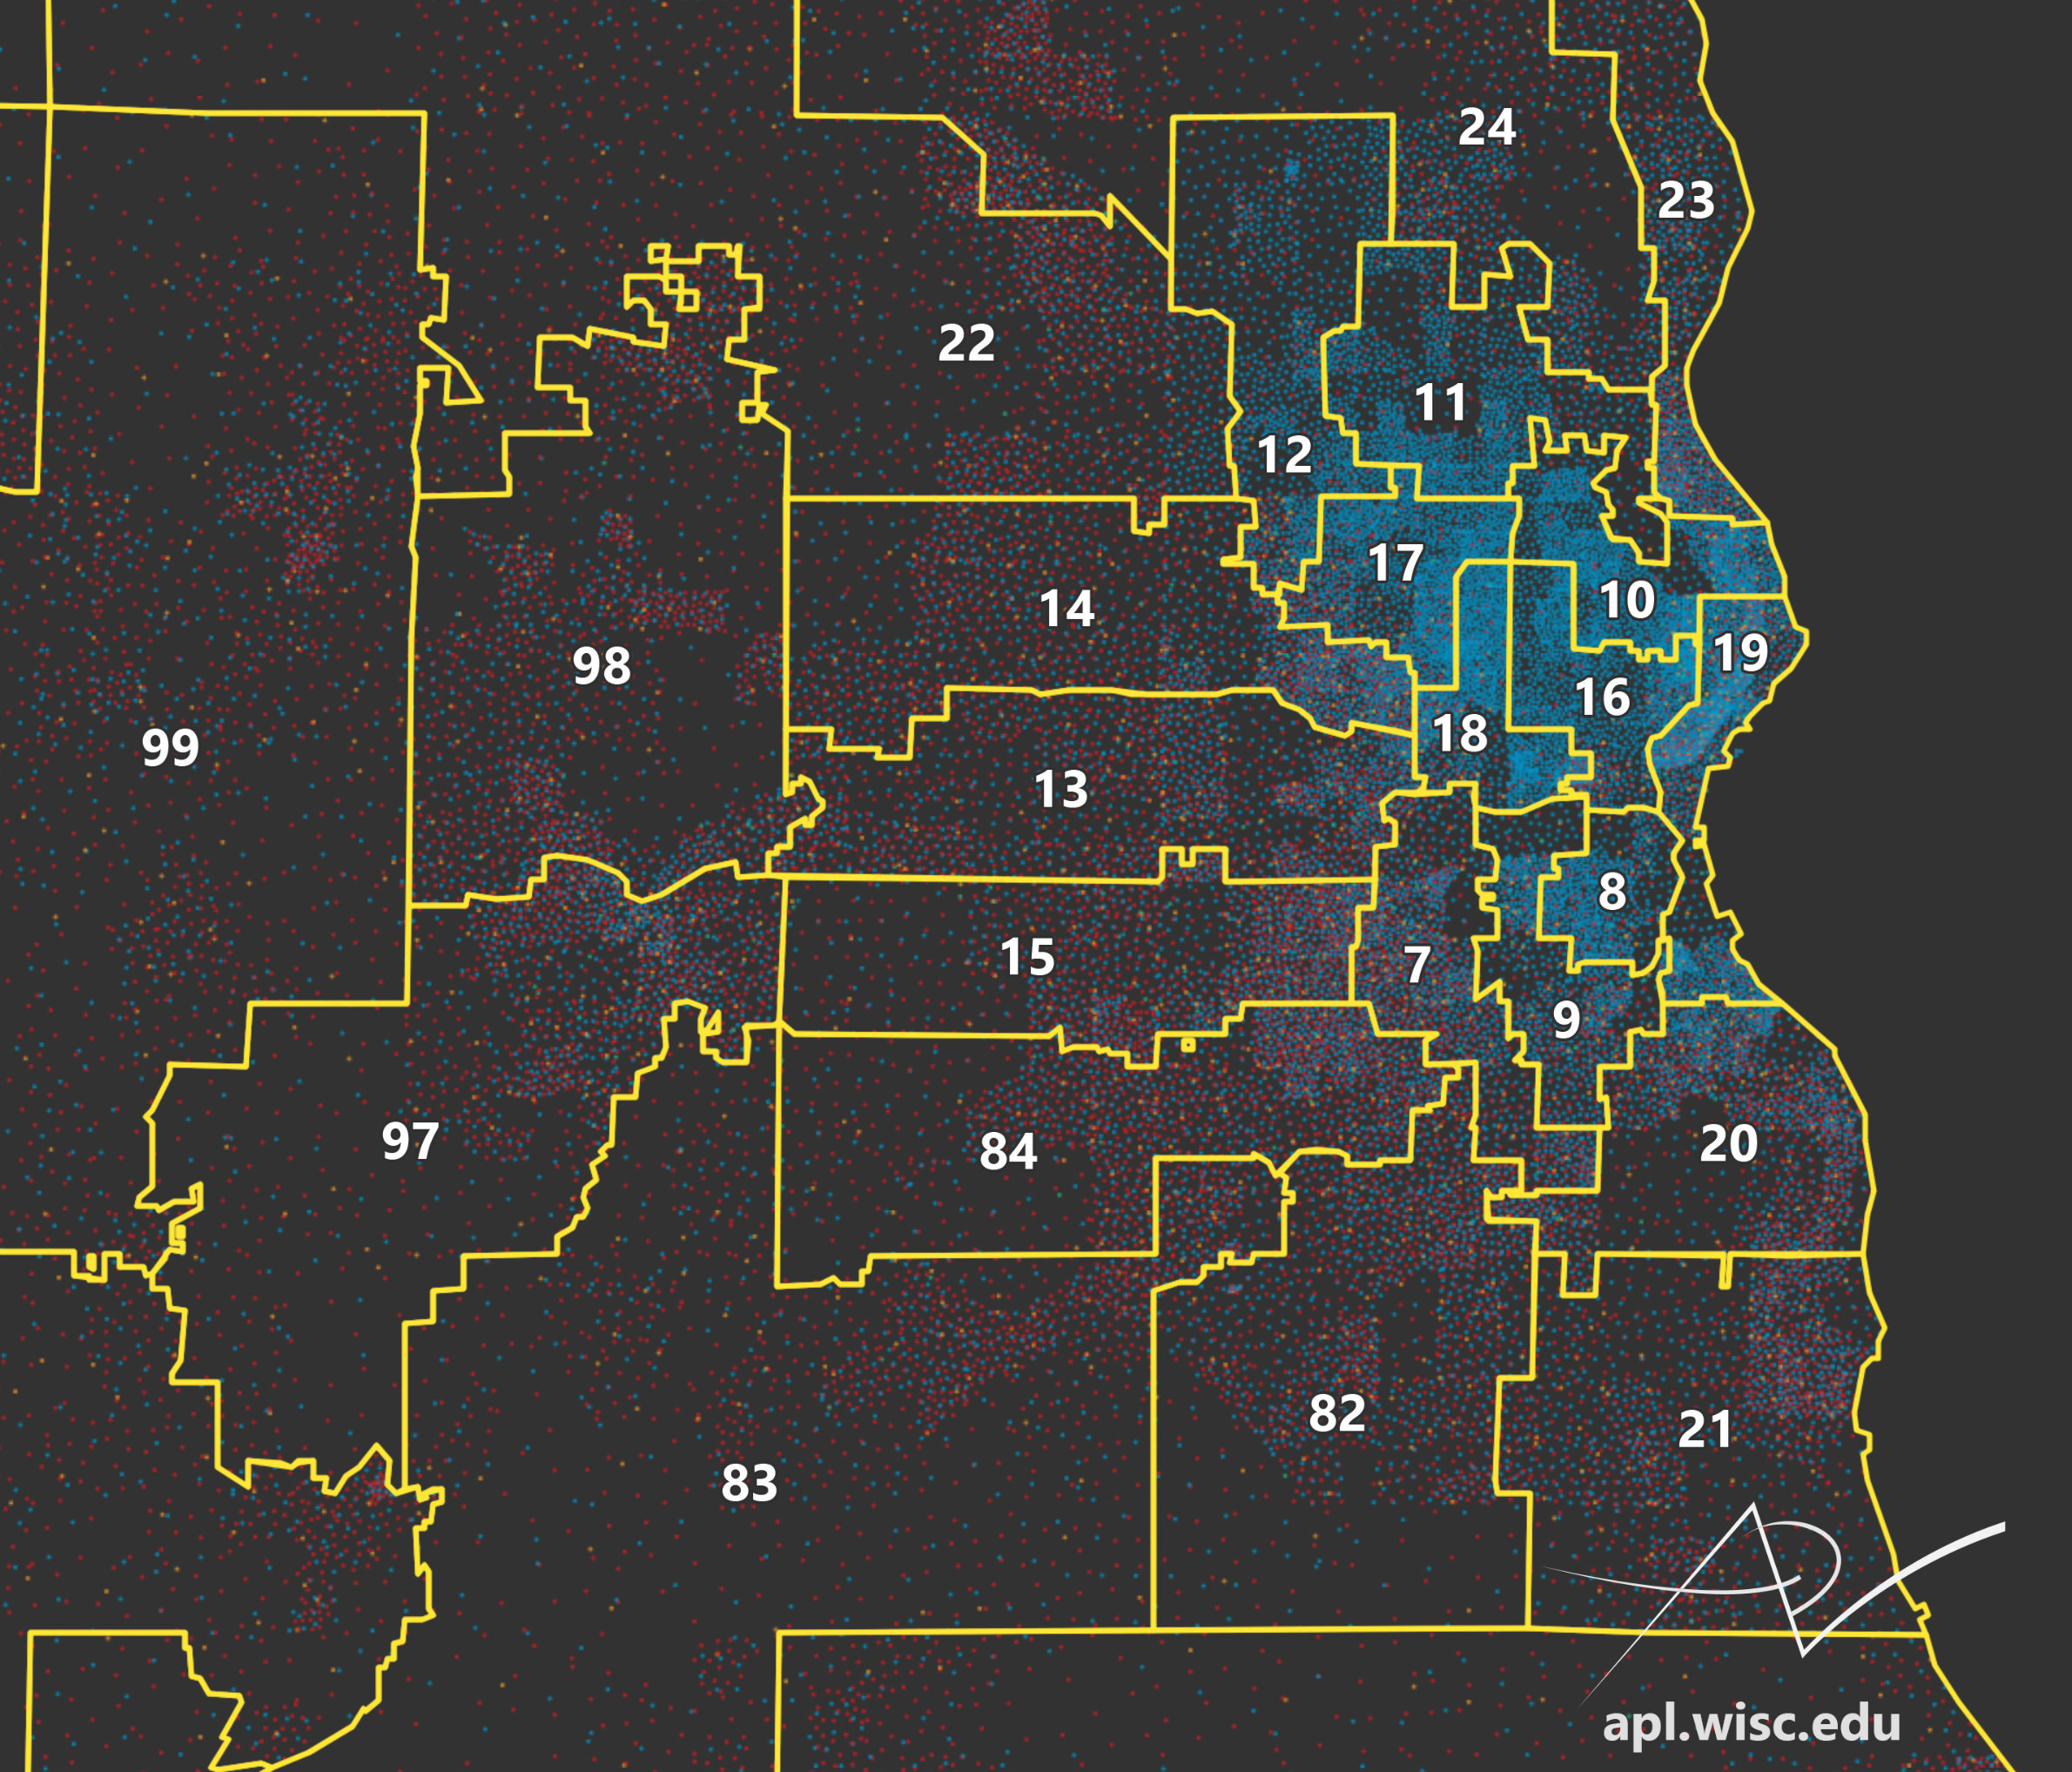 Caitlin McKown/UW Applied Population Lab
The outlines of the Wisconsin Assembly map adopted in 2011 illustrate how Democratic votes in the 2016 presidential election, centered in the city of Milwaukee, are distributed among the legislative districts.
These parts of Milwaukee also display a dramatic concentration of lower-income African American residents, who are much more likely to vote for Democrats. In fact, Milwaukee has arguably the strongest patterns of segregation by race and class of any city in the nation.
Therefore, it’s unclear at a glance whether these particularly blue districts indicates purposeful packing on the part of the mapmakers, or simply the product of the extreme segregation patterns within the Milwaukee metro area. A map of the state legislative districts approved in 2001 through a bipartisan process similarly shows several central Milwaukee districts with very high concentrations of Democratic voters.
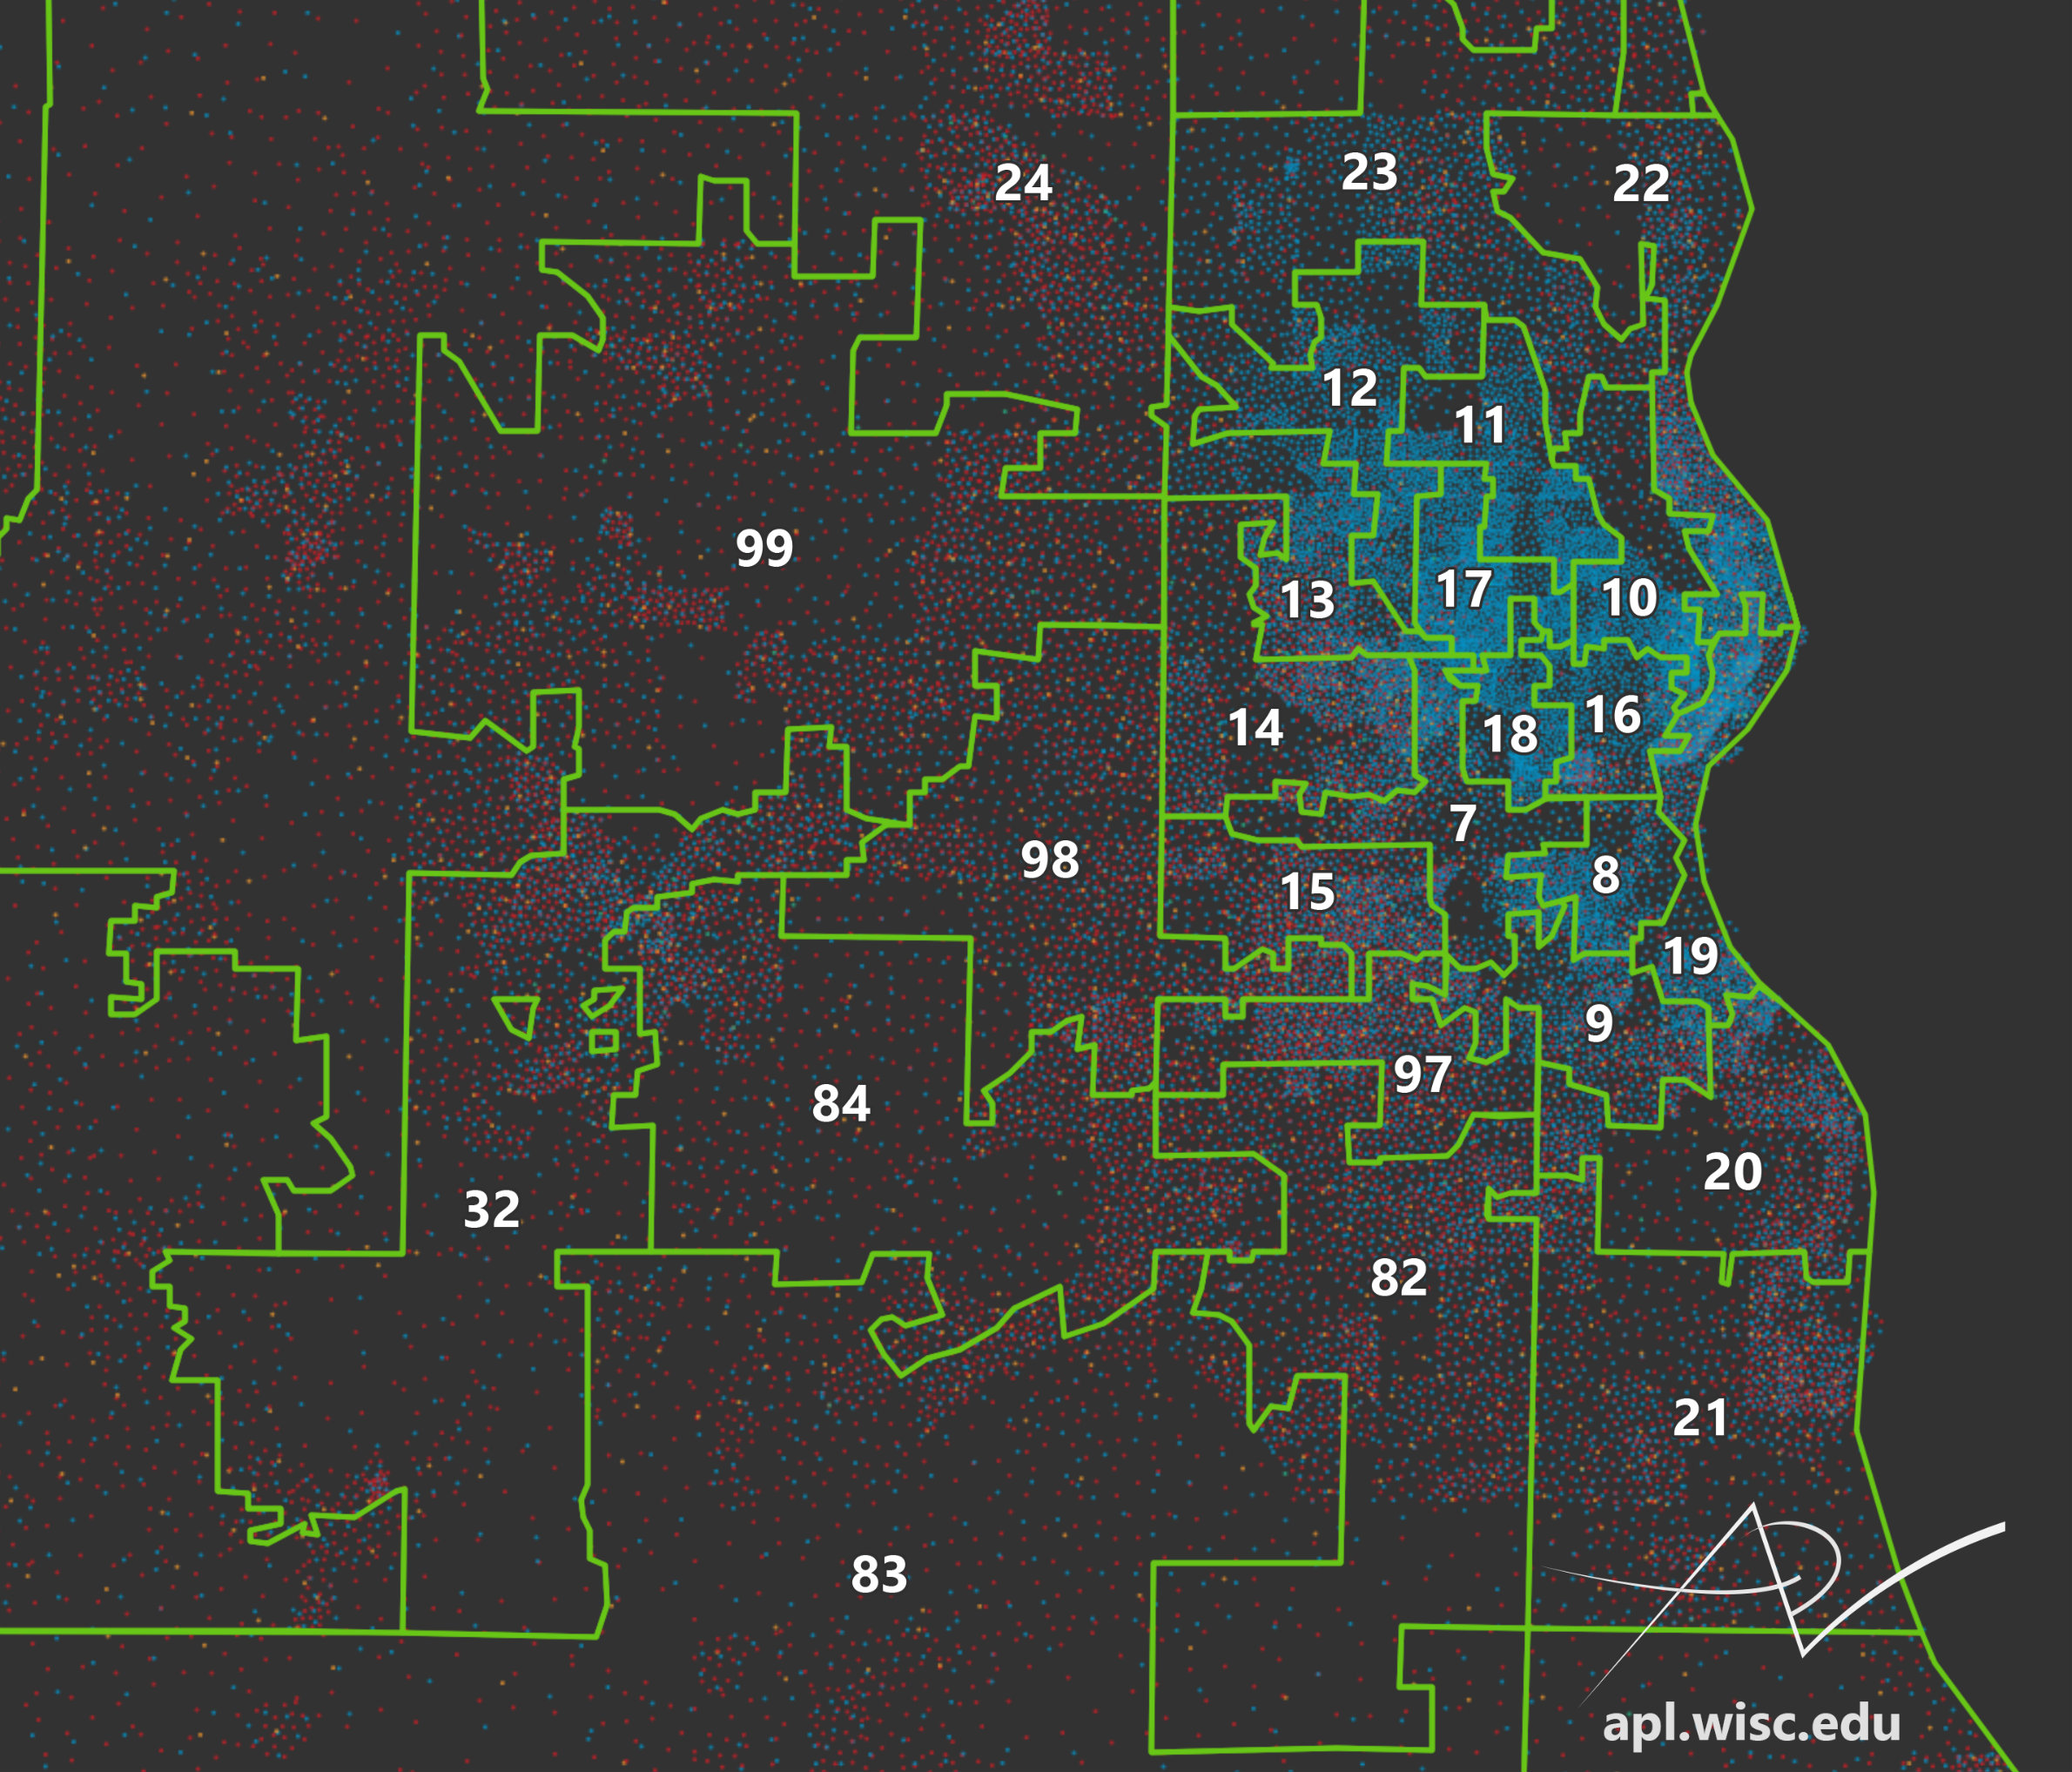 Caitlin McKown/UW Applied Population Lab
The outlines of the Wisconsin Assembly map adopted in 2001 illustrate how Democratic votes in the 2016 presidential election, centered in the city of Milwaukee, could be distributed among the legislative districts.
Evidence of cracking is a bit more obvious upon examination of the 2011 map for the Milwaukee region. A close look at the suburbs shows a ring of districts which each have a little piece of the city of Milwaukee, rich in Democratic voters, and a large piece of the surrounding suburbs, which are strongly Republican-leaning. This ring includes districts 13, 14,15, 20, 22, 23, 24, 82, 83, and 84 — all but one of these 10 seats was held by a Republican in 2018.
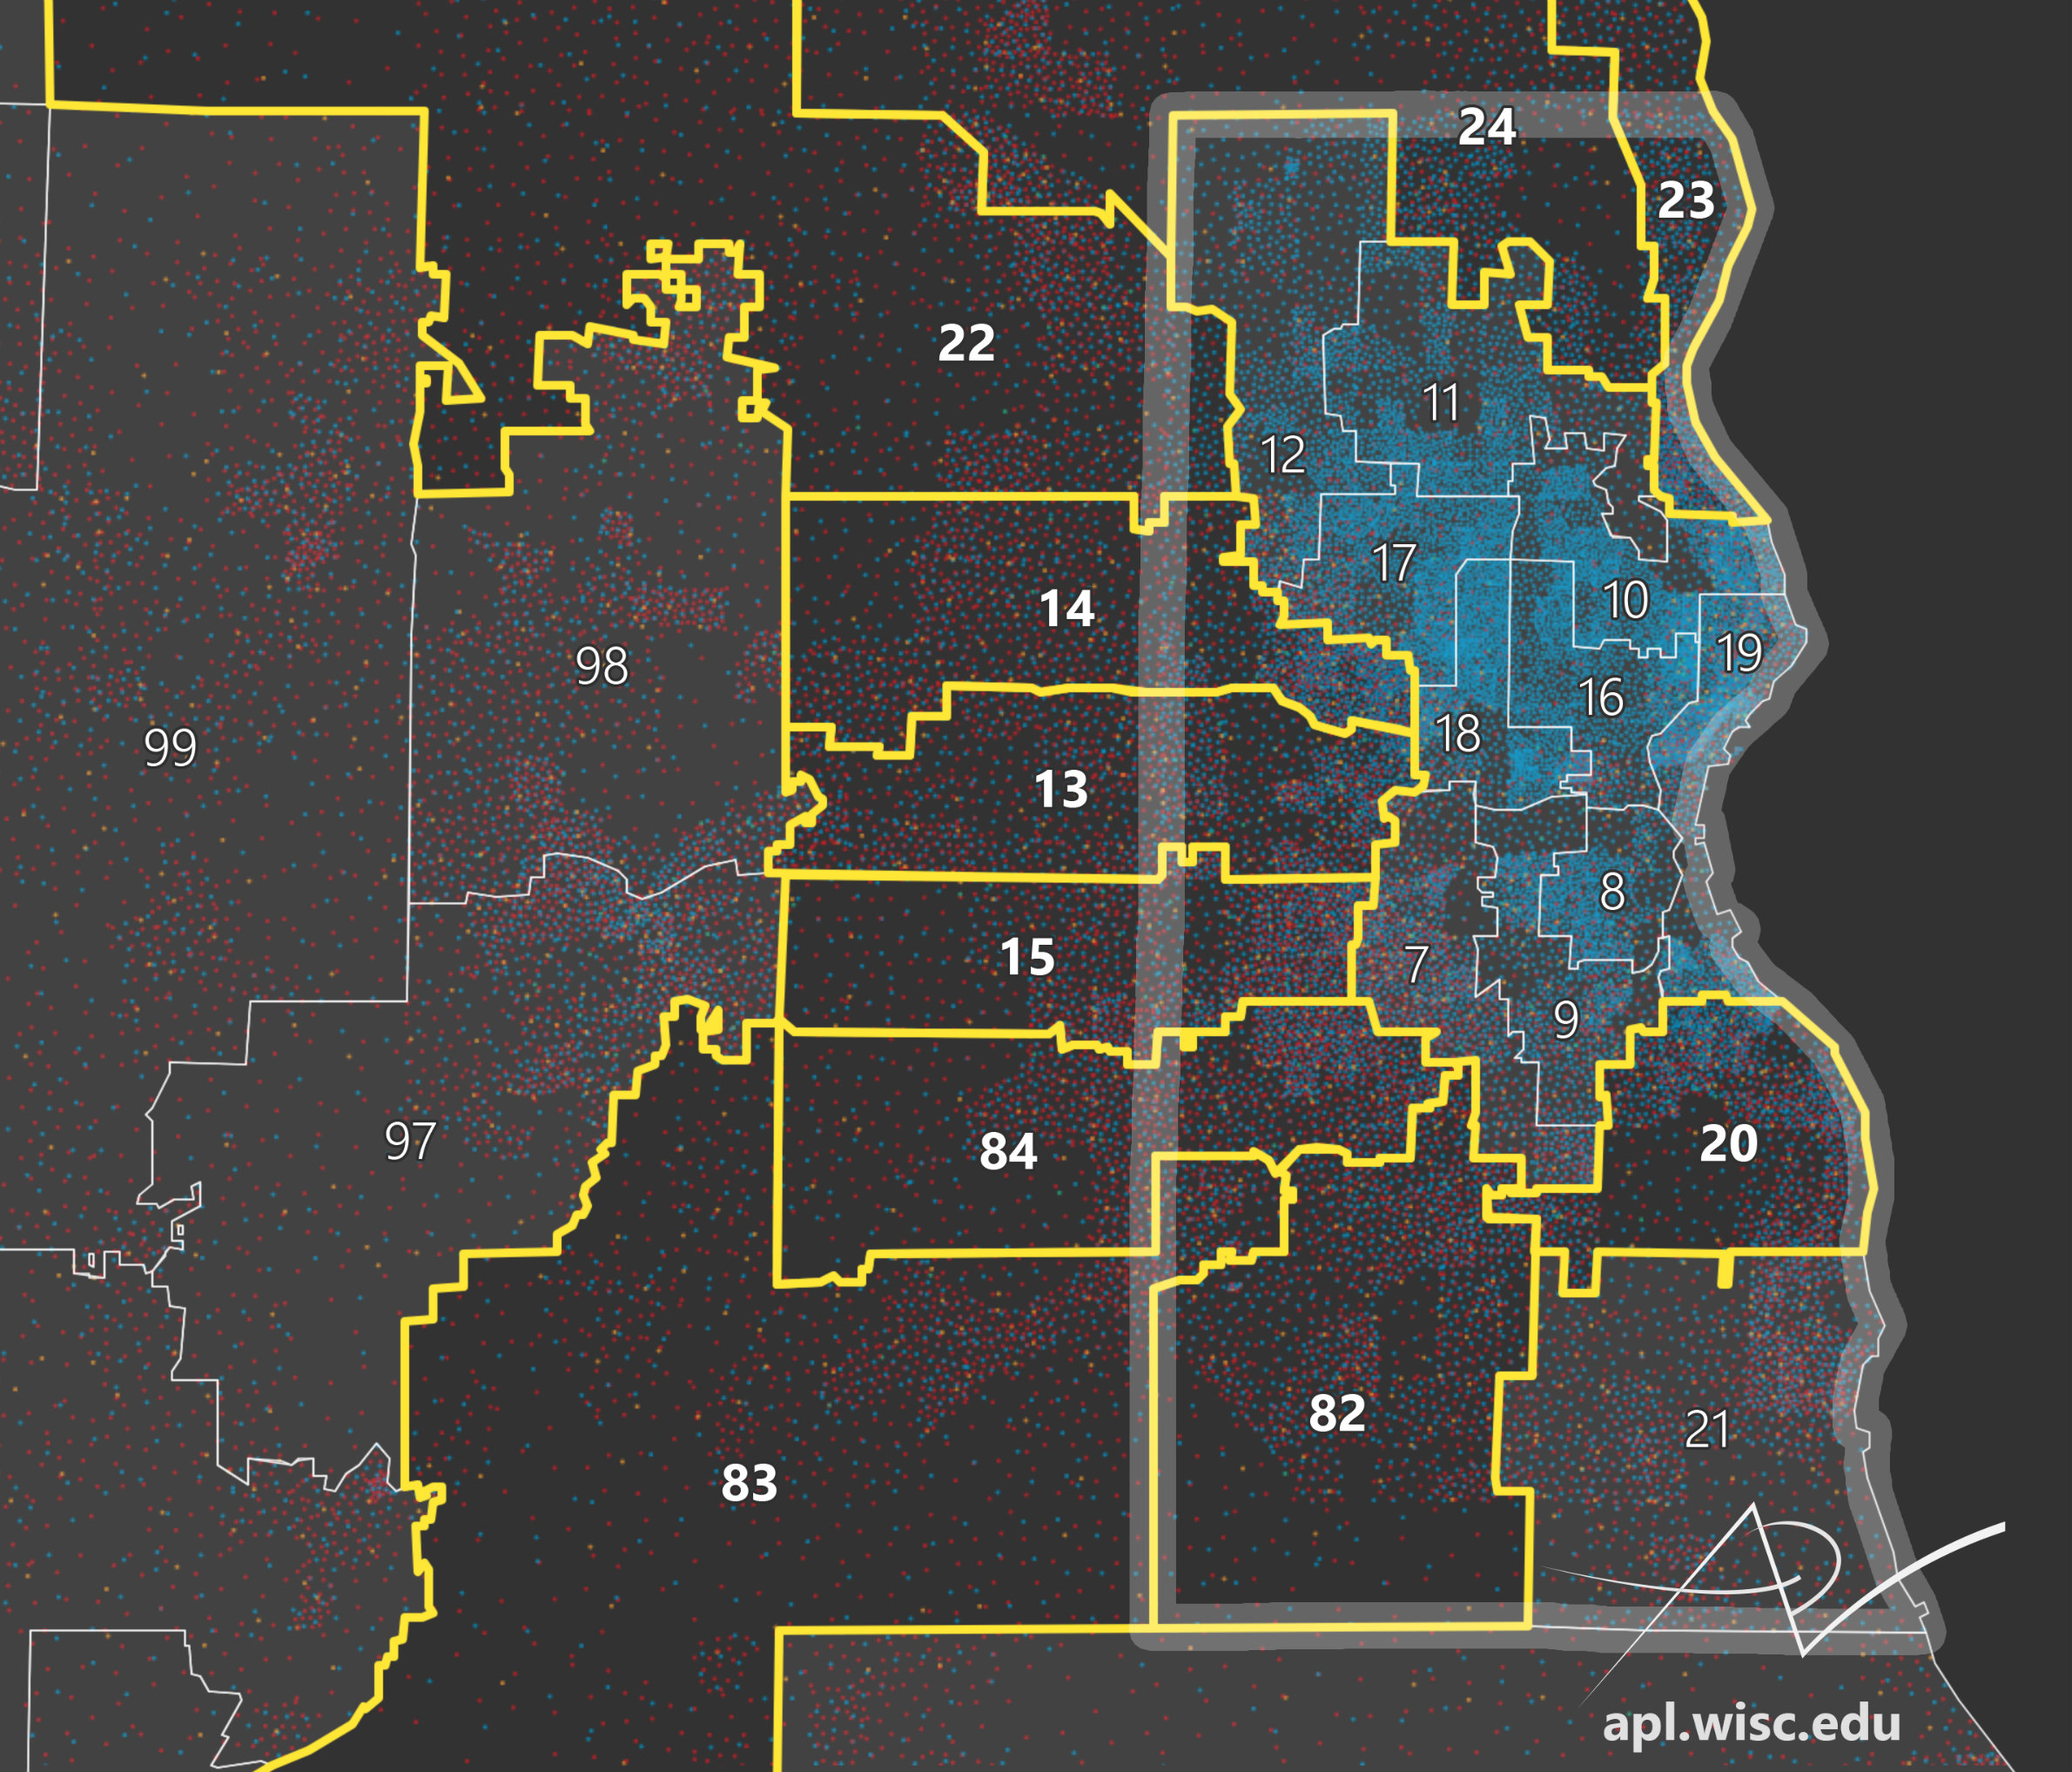 Caitlin McKown/UW Applied Population Lab
The 2011 Wisconsin Assembly districts surrounding Milwaukee show evidence of cracking, one method of electoral gerrymandering.
How different is the 2011 map from the previous set of legislative districts? The 2001 map reveals a radically different political geography in the Milwaukee suburbs. It is so different from a geographic perspective that it’s not possible to directly compare districts according to their numbers and say definitively whether a seat “flipped” following the redistricting process. The most notable difference is that in 2001, districts were by and large drawn to respect the Milwaukee County boundary, the vertical line that runs down most of the center of this map view.
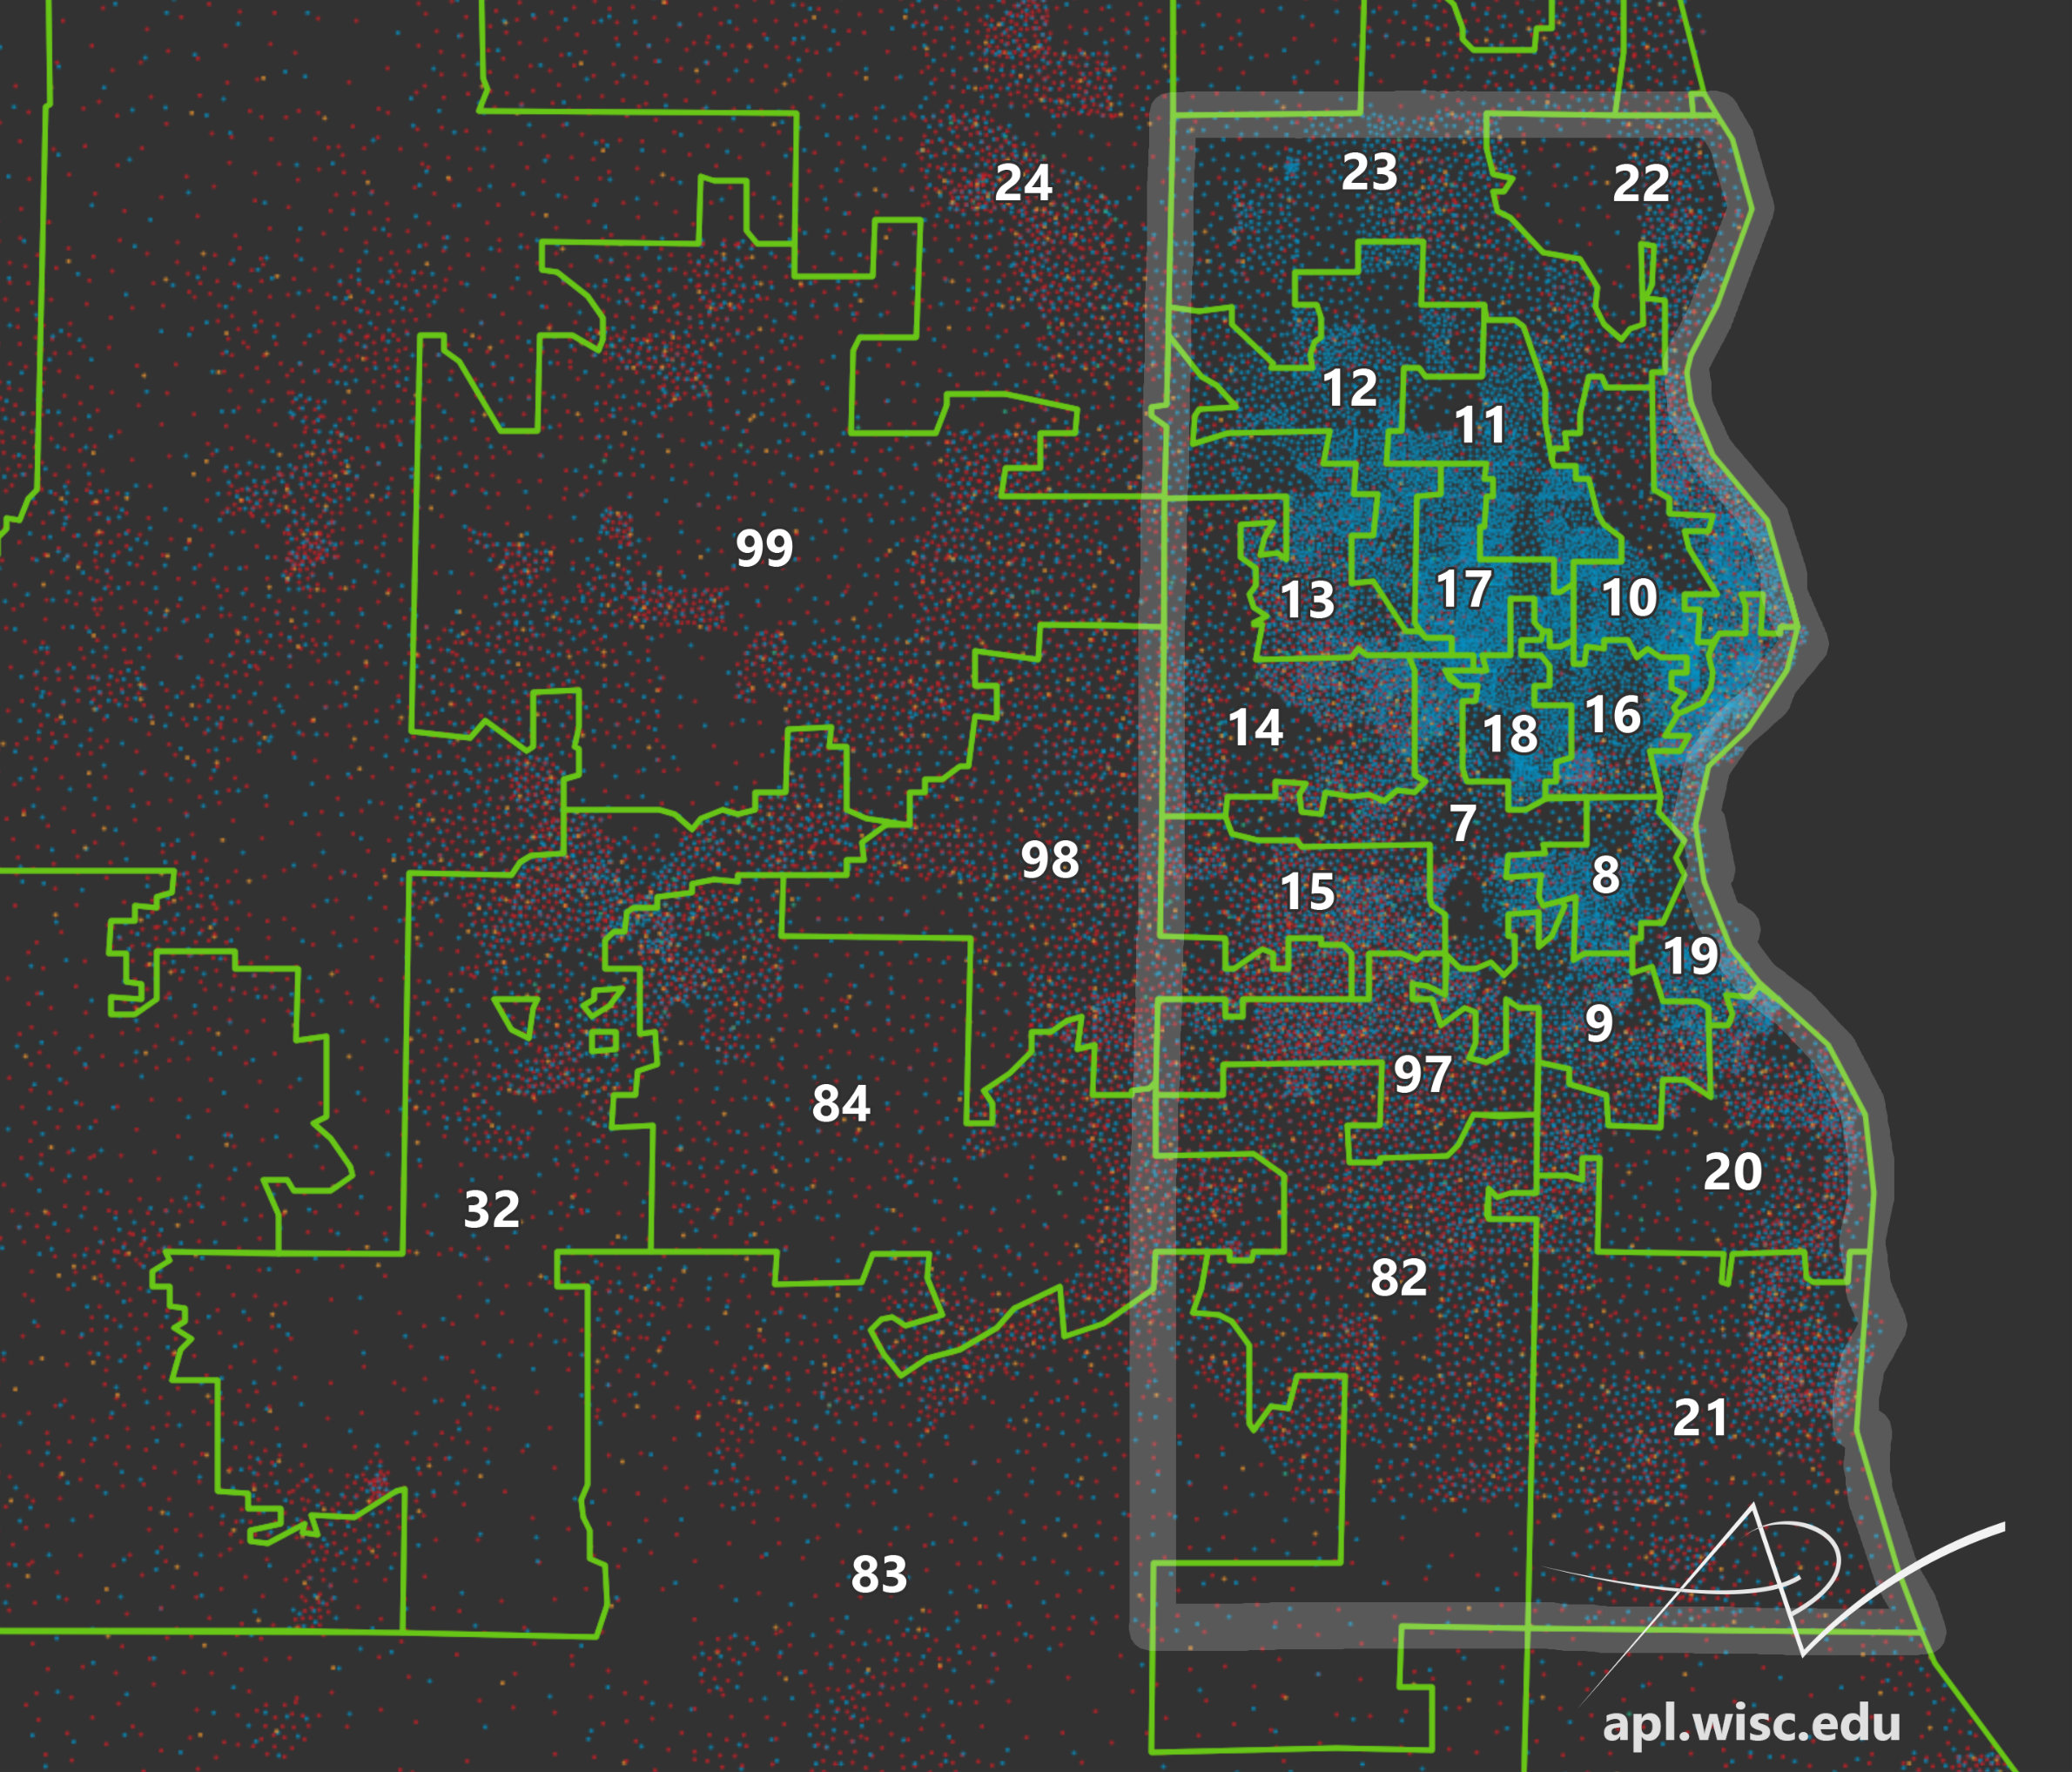 Caitlin McKown/UW Applied Population Lab
The creators of the 2011 districts didn’t follow the state constitution’s directive that legislative districts should respect county boundaries whenever possible, and created a map that cracked the central and near-suburb bloc of Democratic voters across many districts that reach into the far-flung and deeply conservative suburbs of neighboring Waukesha, Ozaukee and Washington counties. These suburbanized areas are populated in large part by affluent, white conservative voters.
In the era of white flight, whites left Milwaukee, city and county, in favor of neighboring counties. The historical suburbanization process itself led to counties with very different political profiles. Given the state constitution’s requirement that districts preserve communities of interest, Assembly members who represent constituents across a county boundary are potentially problematic.
A more rigorous definition of gerrymandering
One of the unique things about Gill v. Whitford is that, unlike many other gerrymandering cases, the Wisconsin Assembly districts do not have bizarre shapes. The authors of the 2011 map were able to preserve relatively compact and even-looking districts. However, as argued before the U.S. Supreme Court, evidence of gerrymandering processes like packing and especially cracking are present its districts.
The plaintiffs in the case argued that mathematical evidence of cracking and packing shows that the 2011 maps are a partisan gerrymander, intended to strengthen Republican control of the state Legislature and disenfranchise Democratic voters. One metric of cracking and packing discussed during the case was the efficiency gap, a formula which compares individual votes cast to the total partisan representation in government. When the balance of power in state legislature deviates substantially from the balance of votes at the individual level, lots of people are being represented by someone in the opposing party — deemed by this measurement as evidence of a partisan gerrymander.
In November 2016, a three-judge federal court ruled that Wisconsin’s 2011 state Assembly district map constitutes a partisan gerrymander. The U.S. District Court for the Western District of Wisconsin found that the map’s overall effect is to tip the balance of power toward Republican candidates, helping to ensure the party’s control of the upper and lower houses of the state Legislature. In addition, the demographic patterning of the districts suggests that the 2011 map is inconsistent with a basic premise of representative government — to allow communities of interest to be represented by an official they elect. The cracking present in the districts of the Milwaukee suburbs is perhaps the strongest example of this force in action. The U.S. Supreme Court is issuing its ruling on the case in June 2018.
A closer look at the 2001 and 2011 Wisconsin Assembly districts, along with the 2016 presidential election votes, are available in an interactive map created by the UW Applied Population Lab.
Graphics: Caitlin McKown, UW Applied Population Lab

This report was produced in a partnership between Wisconsin Public Radio, PBS Wisconsin and the University of Wisconsin Cooperative Extension. @ Copyright 2026, Board of Regents of the University of Wisconsin System and Wisconsin Educational Communications Board.