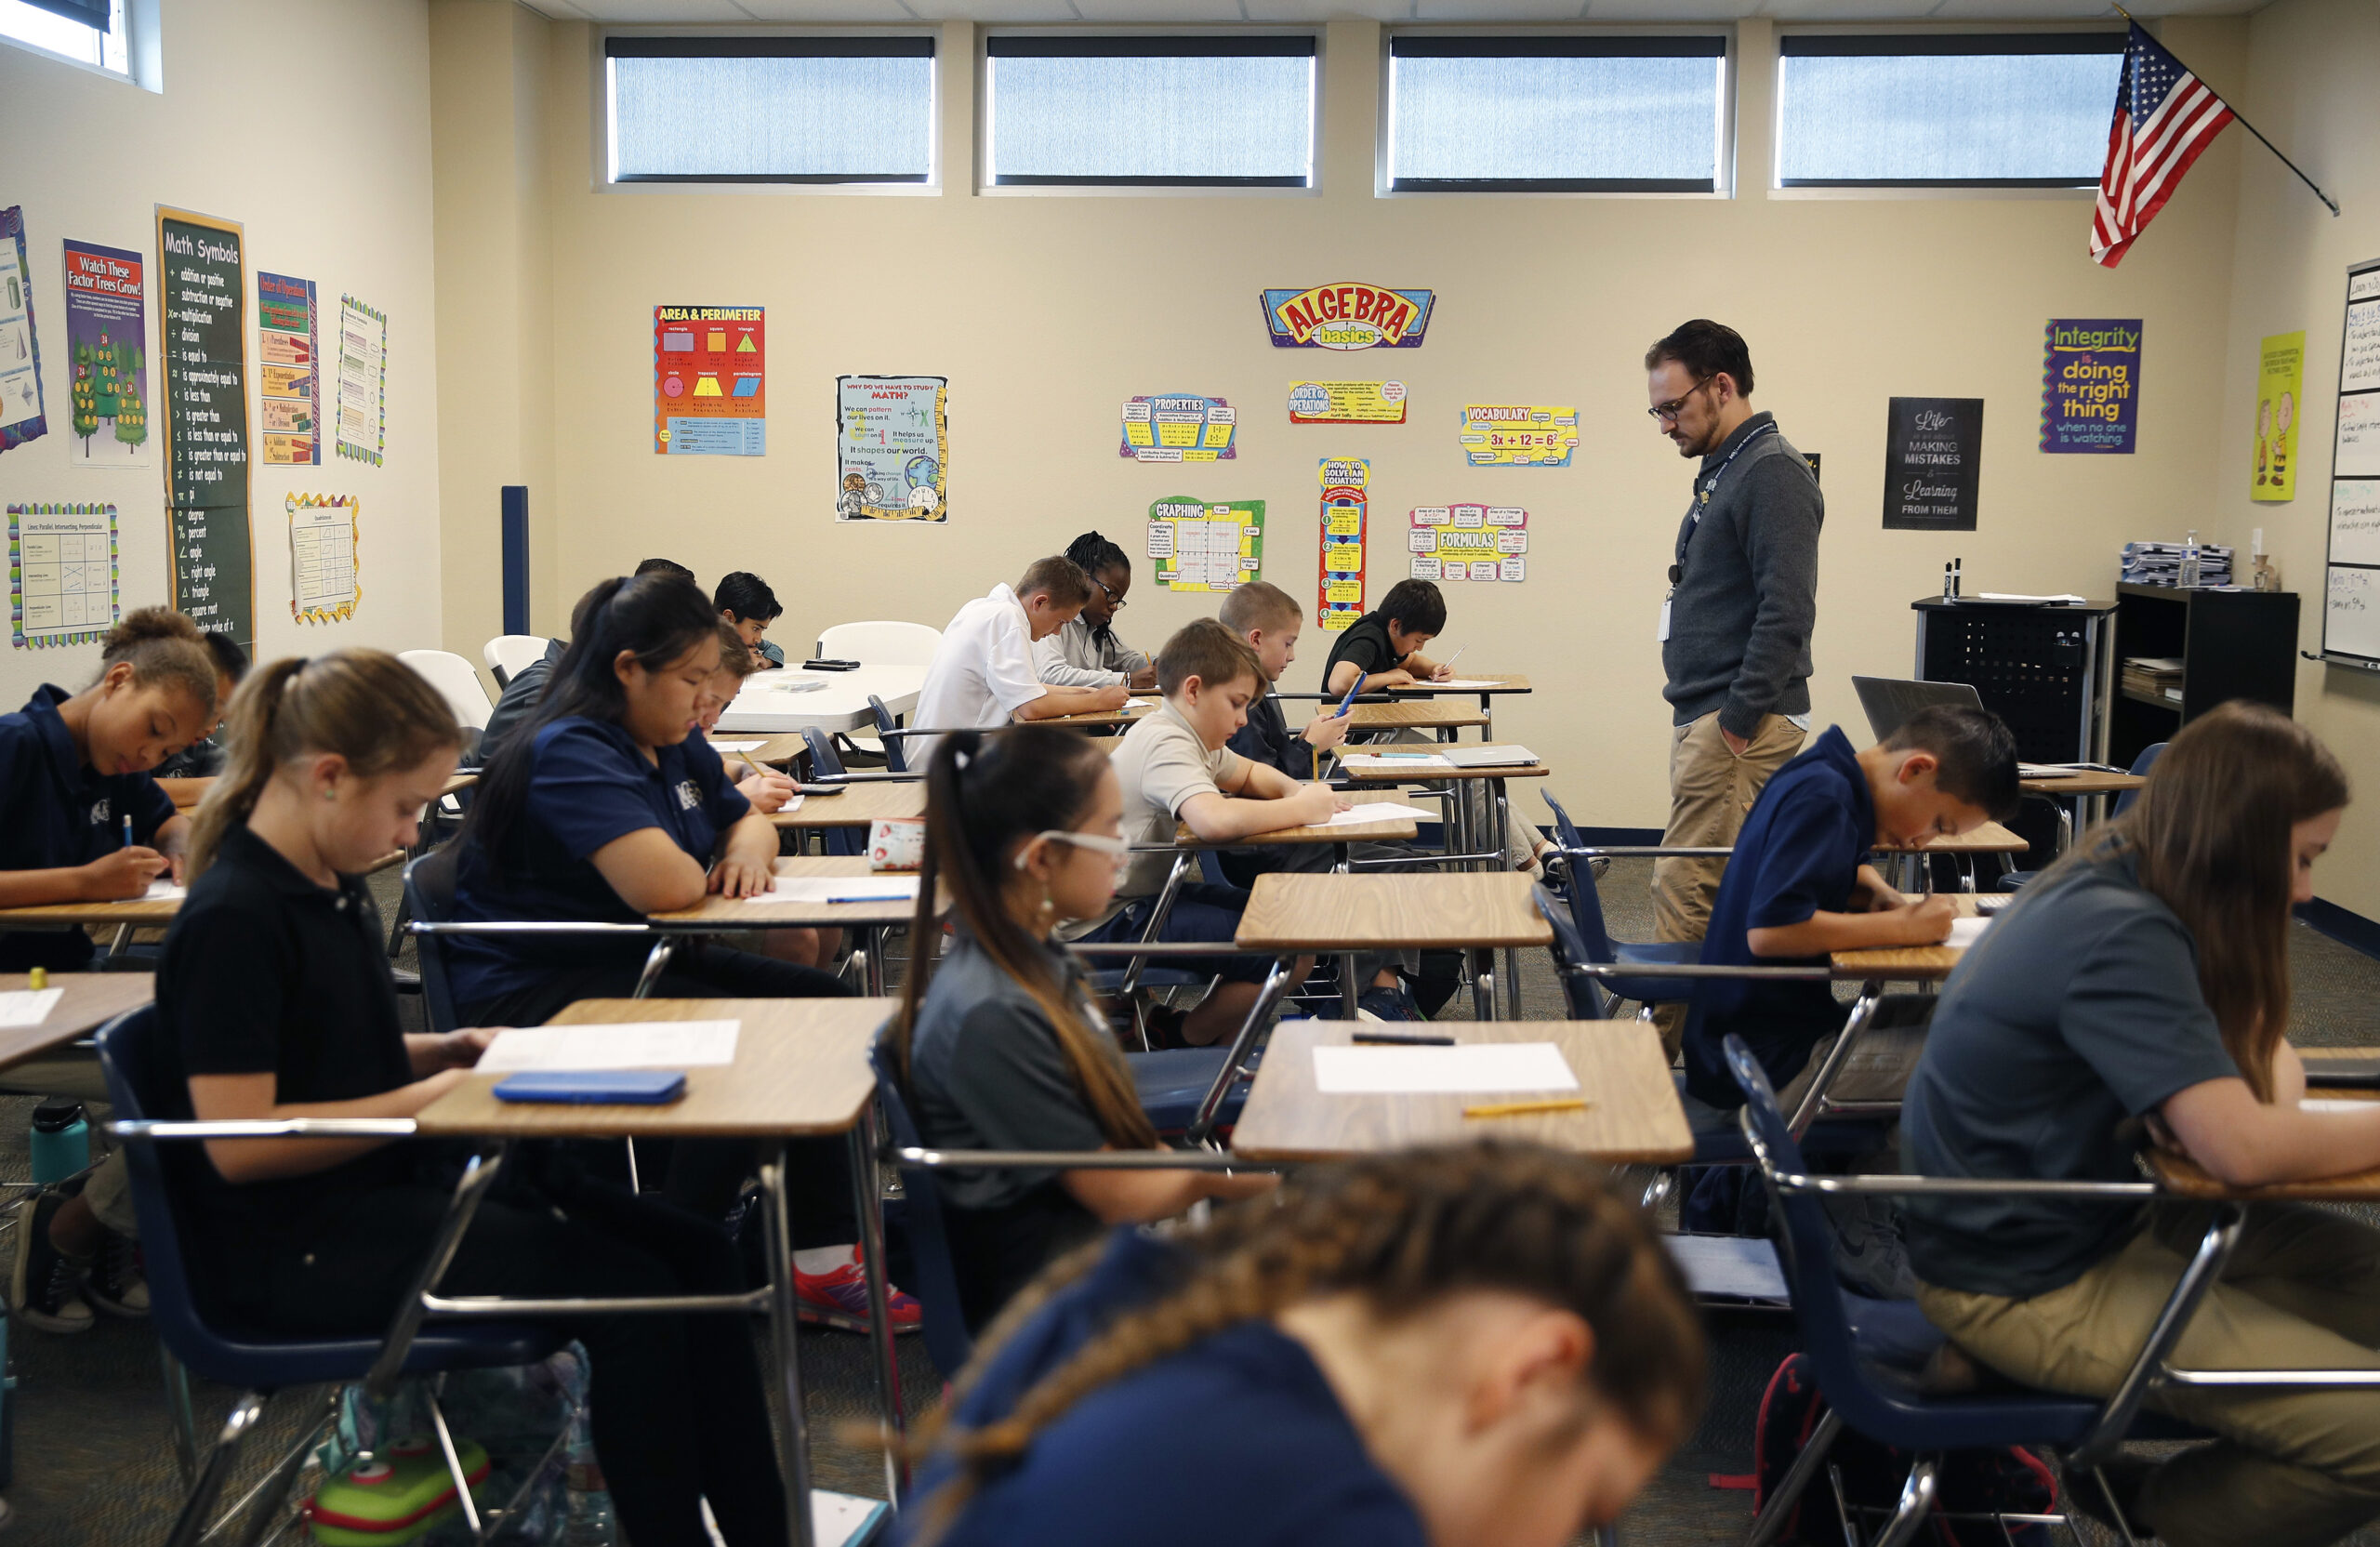

The latest report cards issued by Wisconsin’s Department of Public Instruction show about 95 percent of public school districts met, exceeded or significantly exceeded expectations in the 2021-22 school year.
That’s roughly on par with the percentage of districts that met that threshold during the last assessment period, covering the 2020-21 school year.
But officials warn that the data comes with caveats. Wisconsin’s education department did not release the report cards two school years ago because of the COVID-19 pandemic.
News with a little more humanity
WPR’s “Wisconsin Today” newsletter keeps you connected to the state you love without feeling overwhelmed. No paywall. No agenda. No corporate filter.
“I think we can all agree (those) were pretty strange years,” said Patrick Chambers, an education consultant with DPI’s Office of Educational Accountability, of the pandemic’s effects on the last two assessment periods.
Almost all districts closed in-person school at the end of the 2019-20 school year, but some reopened in-person schooling before the end of the year while others were entirely or partially virtual through the 2020-21 school year.
The current state ratings are derived in part from standardized tests, but those testing requirements were waived during 2019-20 school year. Since each report card uses up to the three years of achievement data, the latest rankings essentially skip test scores from 2019-20 and instead use test data going as far back as 2018-19.
Each school or district gets a numerical score that determines whether it falls into one of five categories: fails to meet expectations; meets few expectations; meets expectations; exceeds expectations or significantly exceeds expectations.
And those overall scores are calculated using four priority areas. The most weight is given to “achievement,” which assesses how well students are meeting state standards in English language arts and math. There’s also a score given for “growth,” meaning how fast students are improving year over year, and a score assessing the extent to which students are on-track to graduate. A score for a priority area known as “target group outcomes” was added in the 2020-21 school year to replace a category previously known as “closing gaps.” Target group outcomes focuses on the students who had the lowest test scores within their school during the prior year, with the goal of assessing whether schools are meeting the needs of the students who need the most support.
In the latest reports cards, none of Wisconsin’s districts landed in the lowest category of failing to meet expectations, which would be an overall score below 48 points. But 22 districts landed in the next-lowest category of “meets few expectations.”
But using those labels to compare a district’s performance to prior years is tricky. Before the 2020-21 school year, for instance, Wisconsin’s numerical cutoff for “fails to meet expectations” was higher, and any district that scored below 53 points would have landed in the lowest category.
Of the 377 public school districts that were assessed, a majority, or about 71 percent, kept the same ranking compared to the prior period in 2020-21. Eighty-four districts moved down in at least one category, while 24 moved up in at least one category, according to DPI.
More than half, or 58 percent, of the 391 private schools participating in Wisconsin’s school choice program weren’t given school report cards because they had too few students and didn’t meet the statistical conditions for assessments. Of the private schools that were assessed, 87 percent met, exceeded or significantly exceeded expectations.
People can search full report cards for districts and individual schools at the Department of Public Instruction’s website.
The Milwaukee Public Schools District, the state’s largest with more than 69,000 students, got an overall score of 56.8, which is in the “meets few expectations” category. The Madison Metropolitan School District met expectations with a score of 67.5 and the Kenosha Unified School District met few expectations with a score of 57.1.
Sam Bohrod, an assistant director at DPI’s Office of Educational Accountability, suggests looking beyond those overall scores and ratings. Among other information, the full report cards break down individual data points including graduation and absenteeism rates for each district and school compared to the state as a whole.
“We always encourage anyone schools and districts, parents, medium members, school board members, the Legislature, whomever, to take a look a little bit deeper into the report cards,” he said. “We think that’s really the more valuable portion of the report cards in some respects.”

Wisconsin Public Radio, © Copyright 2026, Board of Regents of the University of Wisconsin System and Wisconsin Educational Communications Board.