
In the first school report cards released since before the pandemic, 95 percent of public school districts met or exceeded expectations, down from 96 percent in the previous period.
However, the state Department of Public Instruction changed the numerical cutoffs for several categories. The Madison Metropolitan School District, for example, scored 70.2 on its 2020-2021 report card, which marked it as “Exceeds expectations” – but two years before, that score would have put the district in the “Meets expectations” category.

News with a little more humanity
WPR’s “Wisconsin Today” newsletter keeps you connected to the state you love without feeling overwhelmed. No paywall. No agenda. No corporate filter.
“Because of all of that, it’s very difficult — I would say impossible, definitely ill-advised — to compare report cards from this year with any prior year,” said Isral DeBruin, director of communications at the Milwaukee-focused school equity nonprofit City Forward Collective. “Of course, that’s what everybody wants to do — they want to see, did things get better, did things get worse.”
DPI did not respond to an emailed request for comment about the changes Wednesday afternoon, though a representative told the Appleton Post-Crescent that they were made with “a strictly mathematical approach that emphasizes preserving the distribution of school and district ratings produced by the previous standards.”
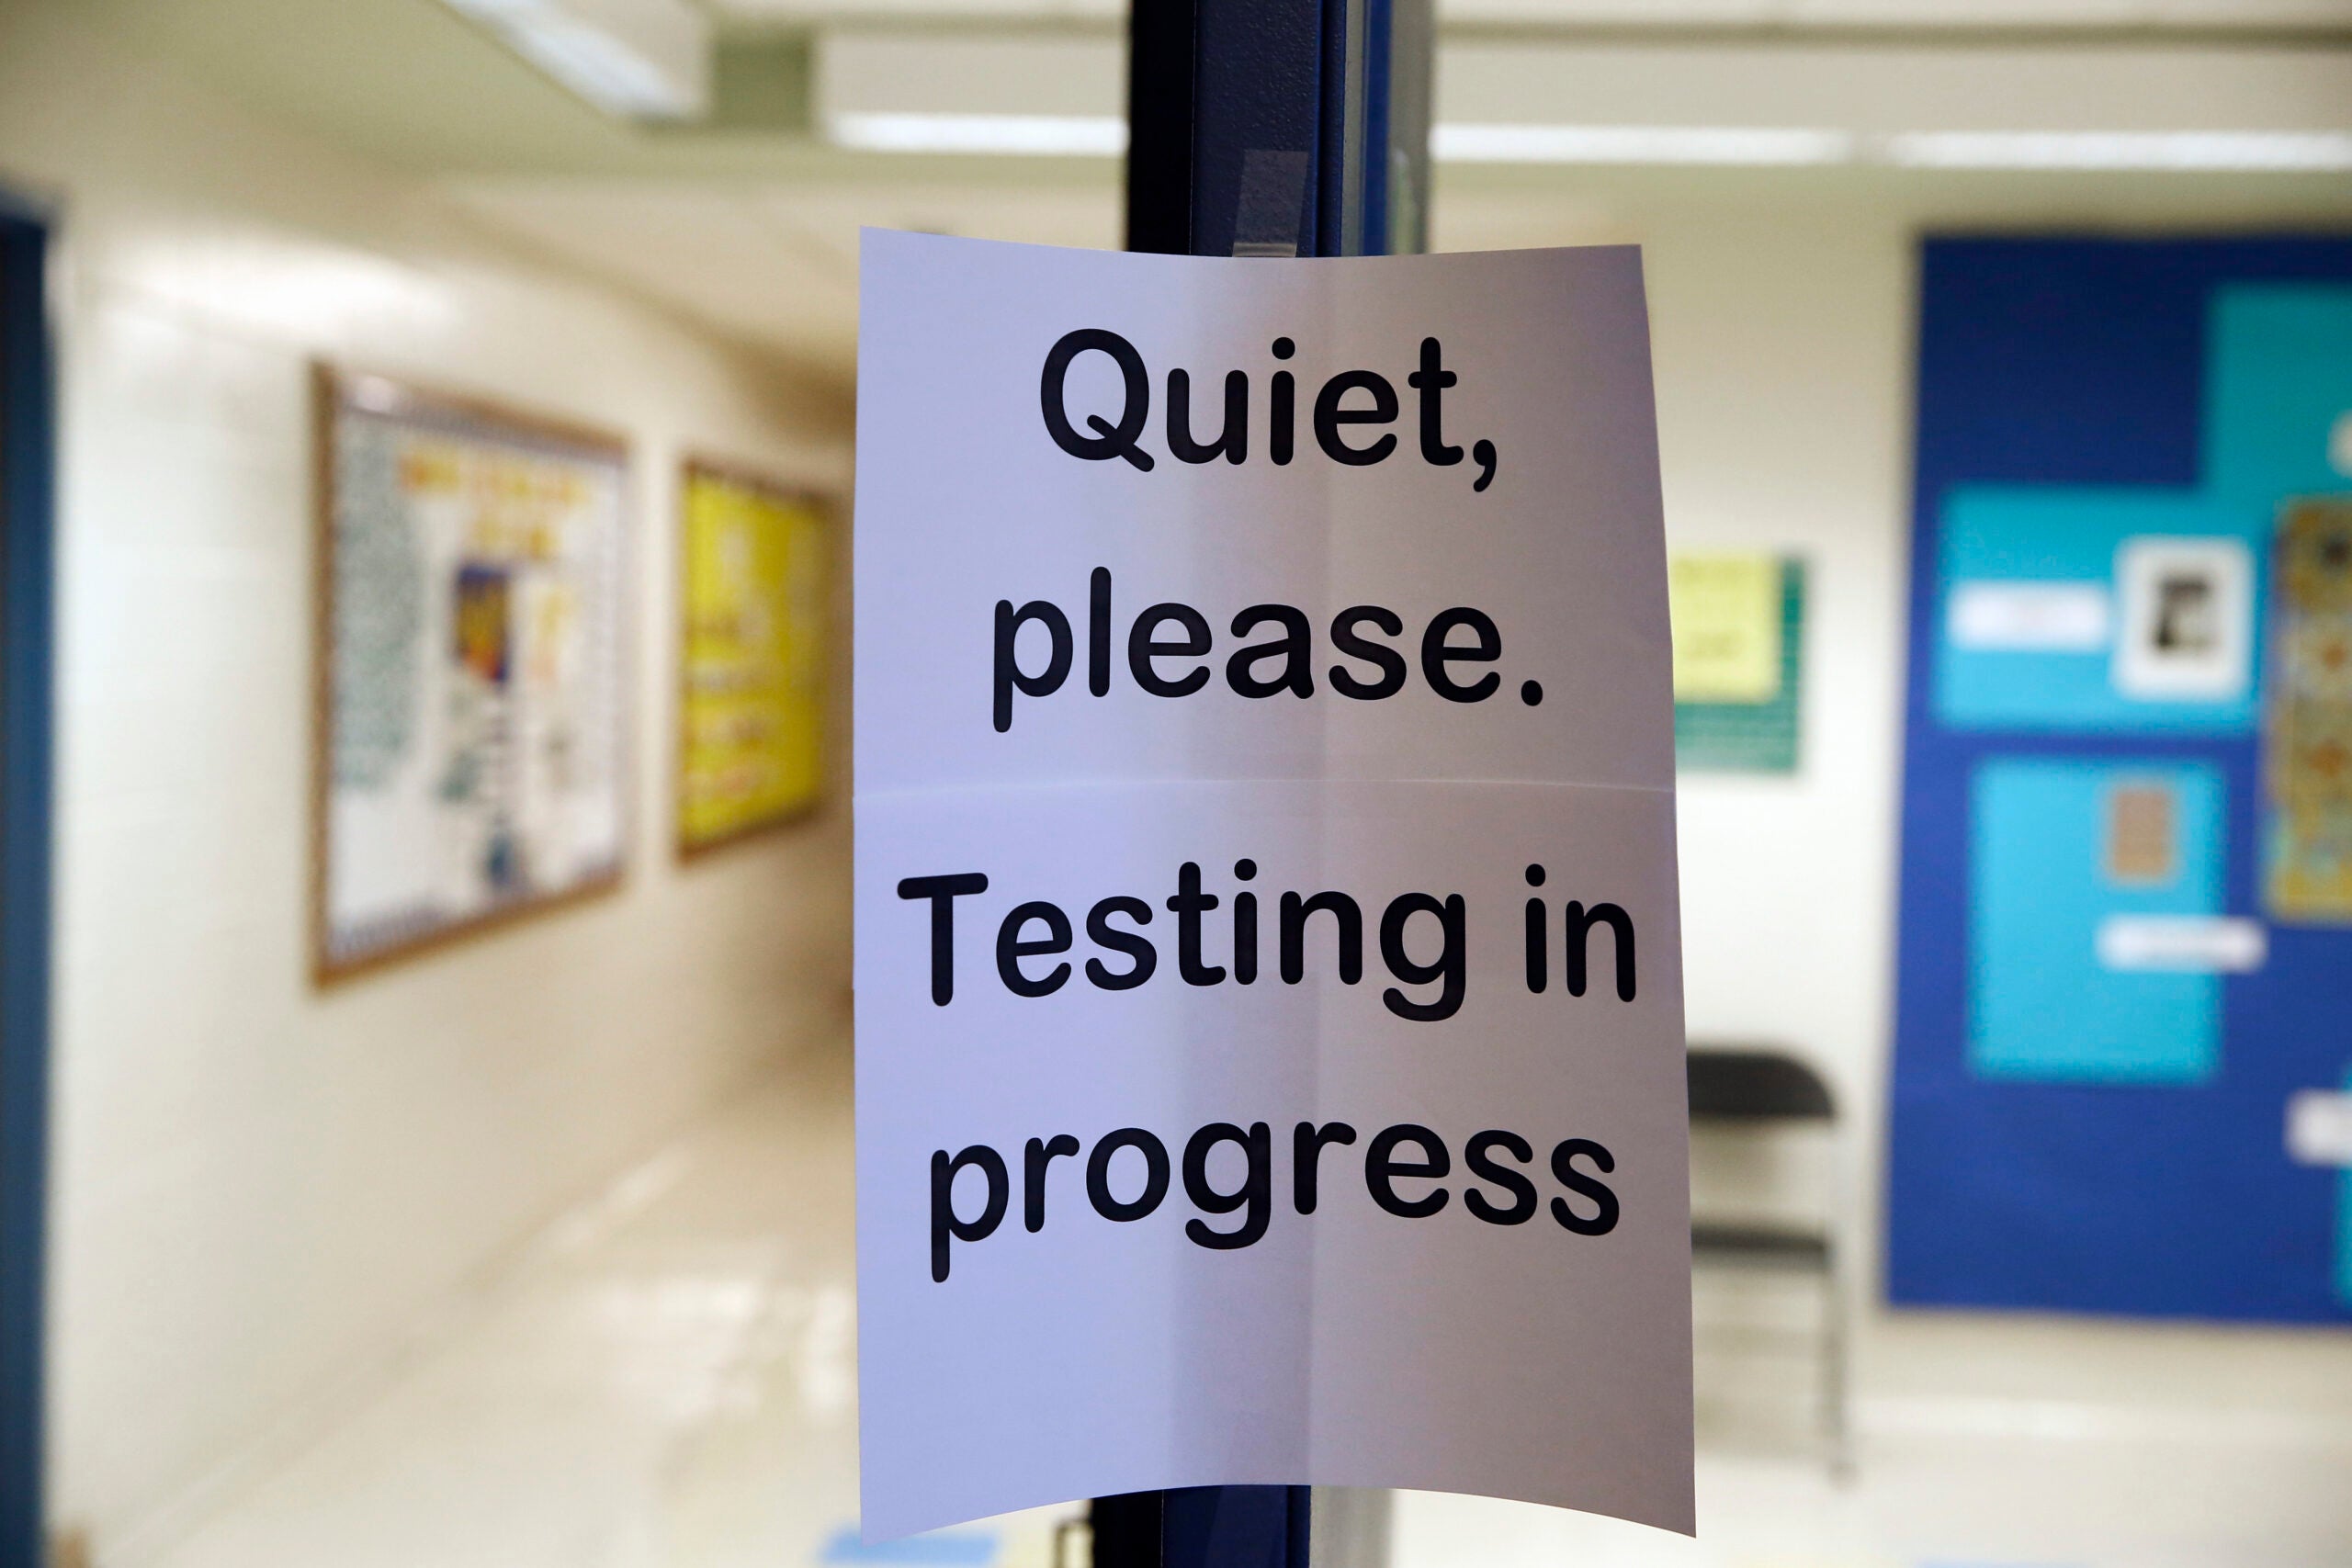
Wisconsin didn’t release school report cards last year because of the pandemic. State officials also requested to suspend the report cards this year — they’re calculated in part using standardized testing, which was significantly impacted by the pandemic — but lawmakers didn’t grant that suspension.
“We urge caution when interpreting scores and ratings on the report cards, due to the disruptions caused by COVID-19,” said Sam Bohrod, assistant director of DPI’s Office of Educational Accountability.
For the 2020-2021 report cards, 2,101 public schools and 376 choice schools received report cards, while 199 public schools and 240 choice schools did not have enough available data to receive scored report cards.
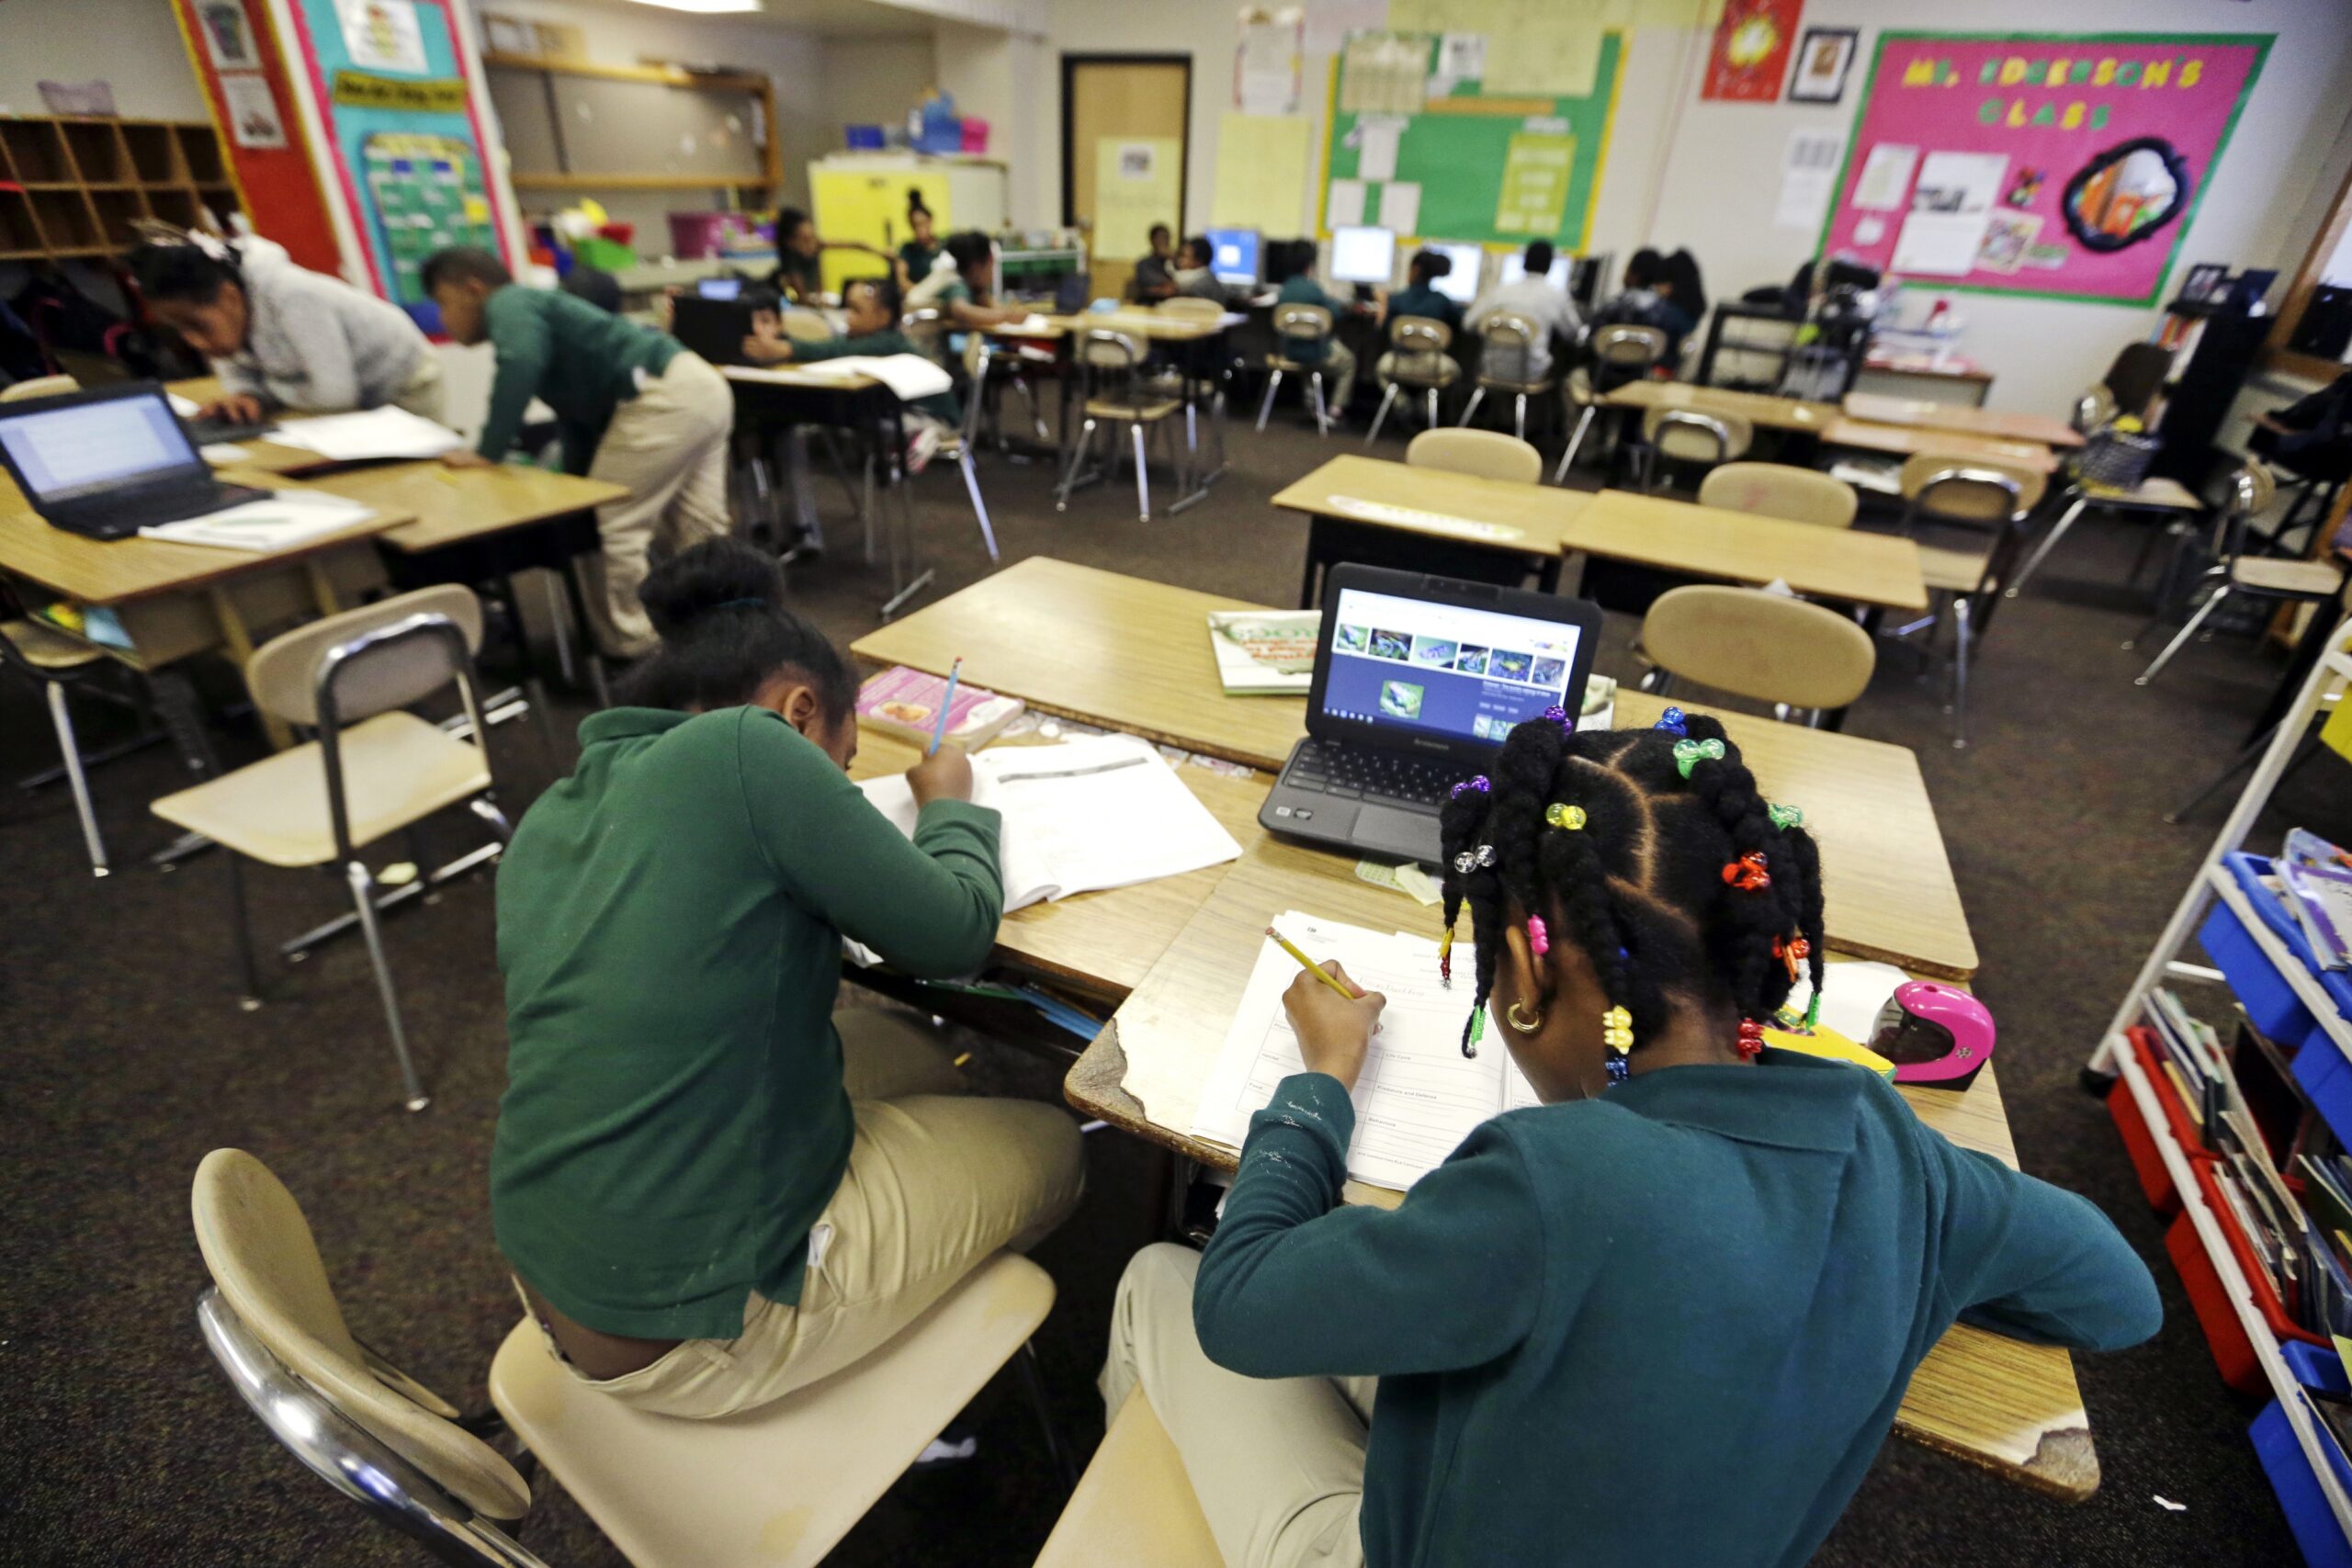
Scores range from one to five stars, with one star meaning a school fails to meet expectations, and five stars meaning schools significantly exceed expectations. Of the 421 school districts that received report cards, 399 had between three and five stars, meaning they met, exceeded or significantly exceeded expectations. School districts get a report card with overall metrics for the entire district, as well as report cards for individual schools.
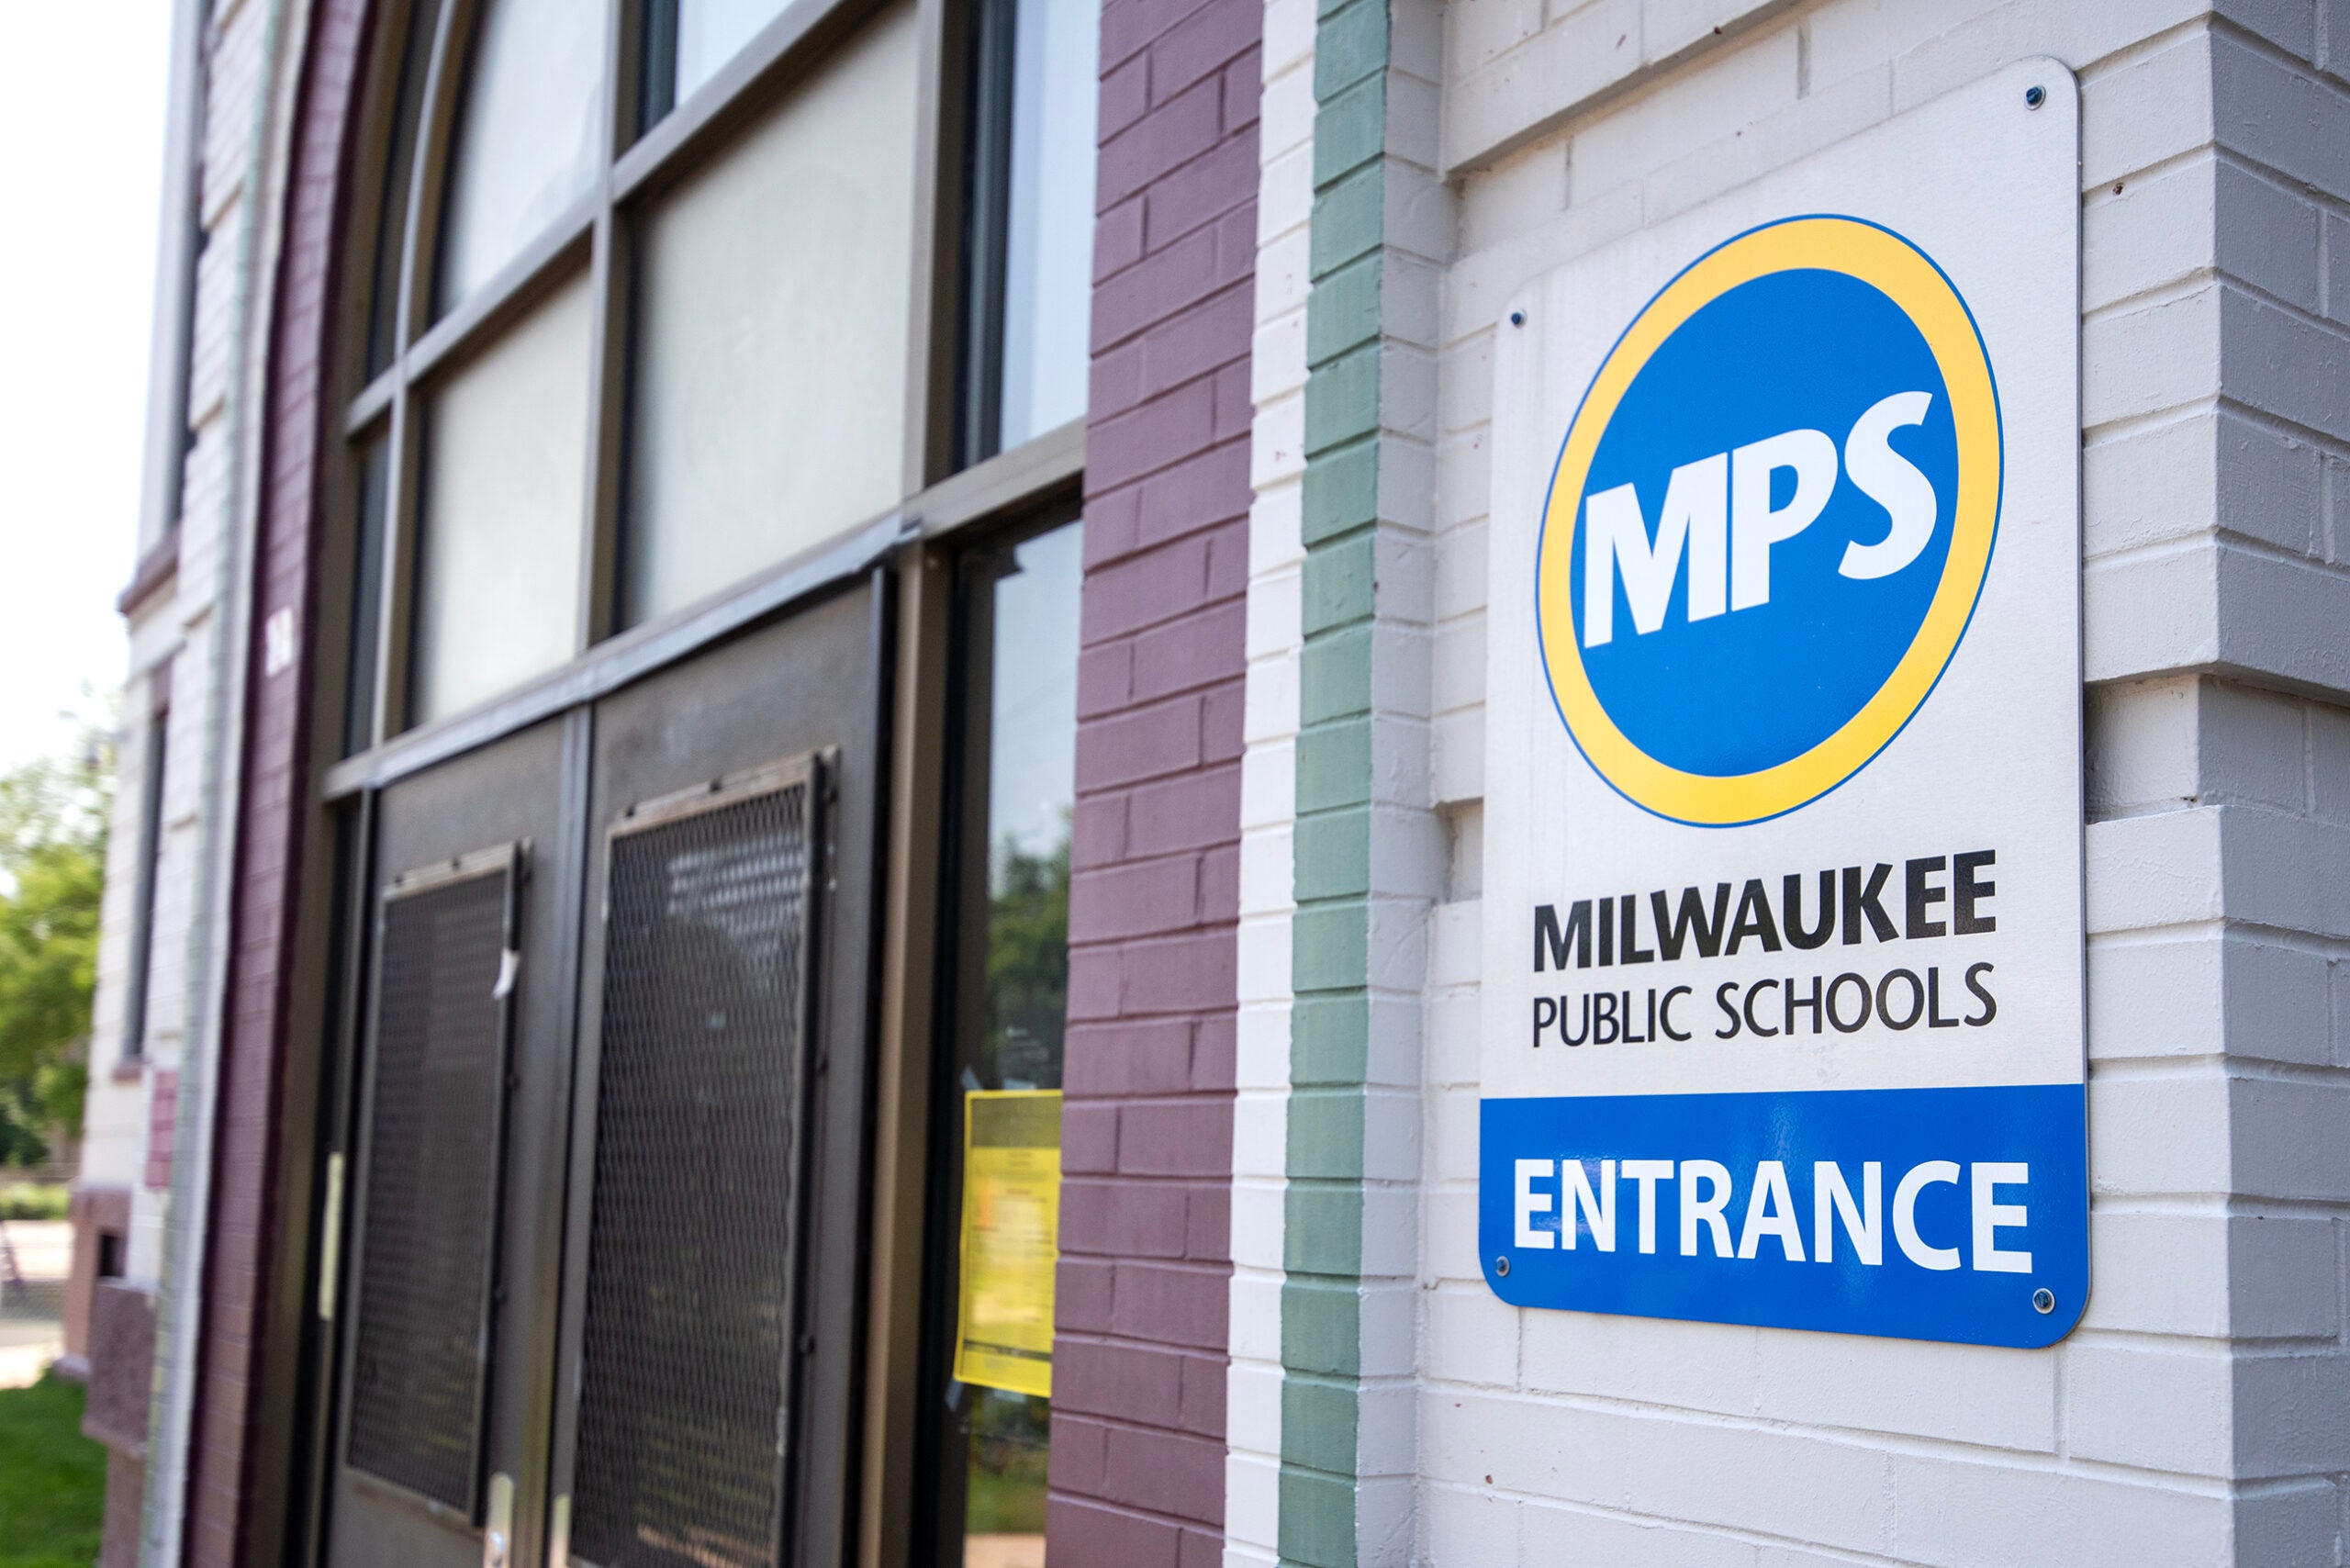
City Forward Collective analyzed the report cards of Milwaukee schools and saw that, across the city, just over 50 percent of students took the standardized tests that factor heavily into school report cards. Typical test participation is in the high 90 percent range.
“When you have a school where only 40 percent of the school took the test, the test being kind of the engine of these report cards, you can’t validly make a comparison between that school and a school where 90 percent of students took the test,” DeBruin said. “You don’t have enough information to make that comparison.”
The DPI report cards saw other significant changes this year, in addition to the changing score cutoffs.
The report cards have four priority areas — achievement, growth, target group outcomes and on-track to graduation. The third category, target group outcomes, is new, and replaces the “closing gaps” priority area on previous report cards. It’s a bit like a report card within the report card, and focuses on students whose test scores are in the lowest quartile.
Schools can also now submit their own narrative, a paragraph that’s included at the top of each report card and consists of a few sentences in which the school describes its mission, its population, or other general information.
Editor’s note: This story was updated to remove an incorrect percentage of schools receiving a “meets expectations” or above score.

Wisconsin Public Radio, © Copyright 2025, Board of Regents of the University of Wisconsin System and Wisconsin Educational Communications Board.