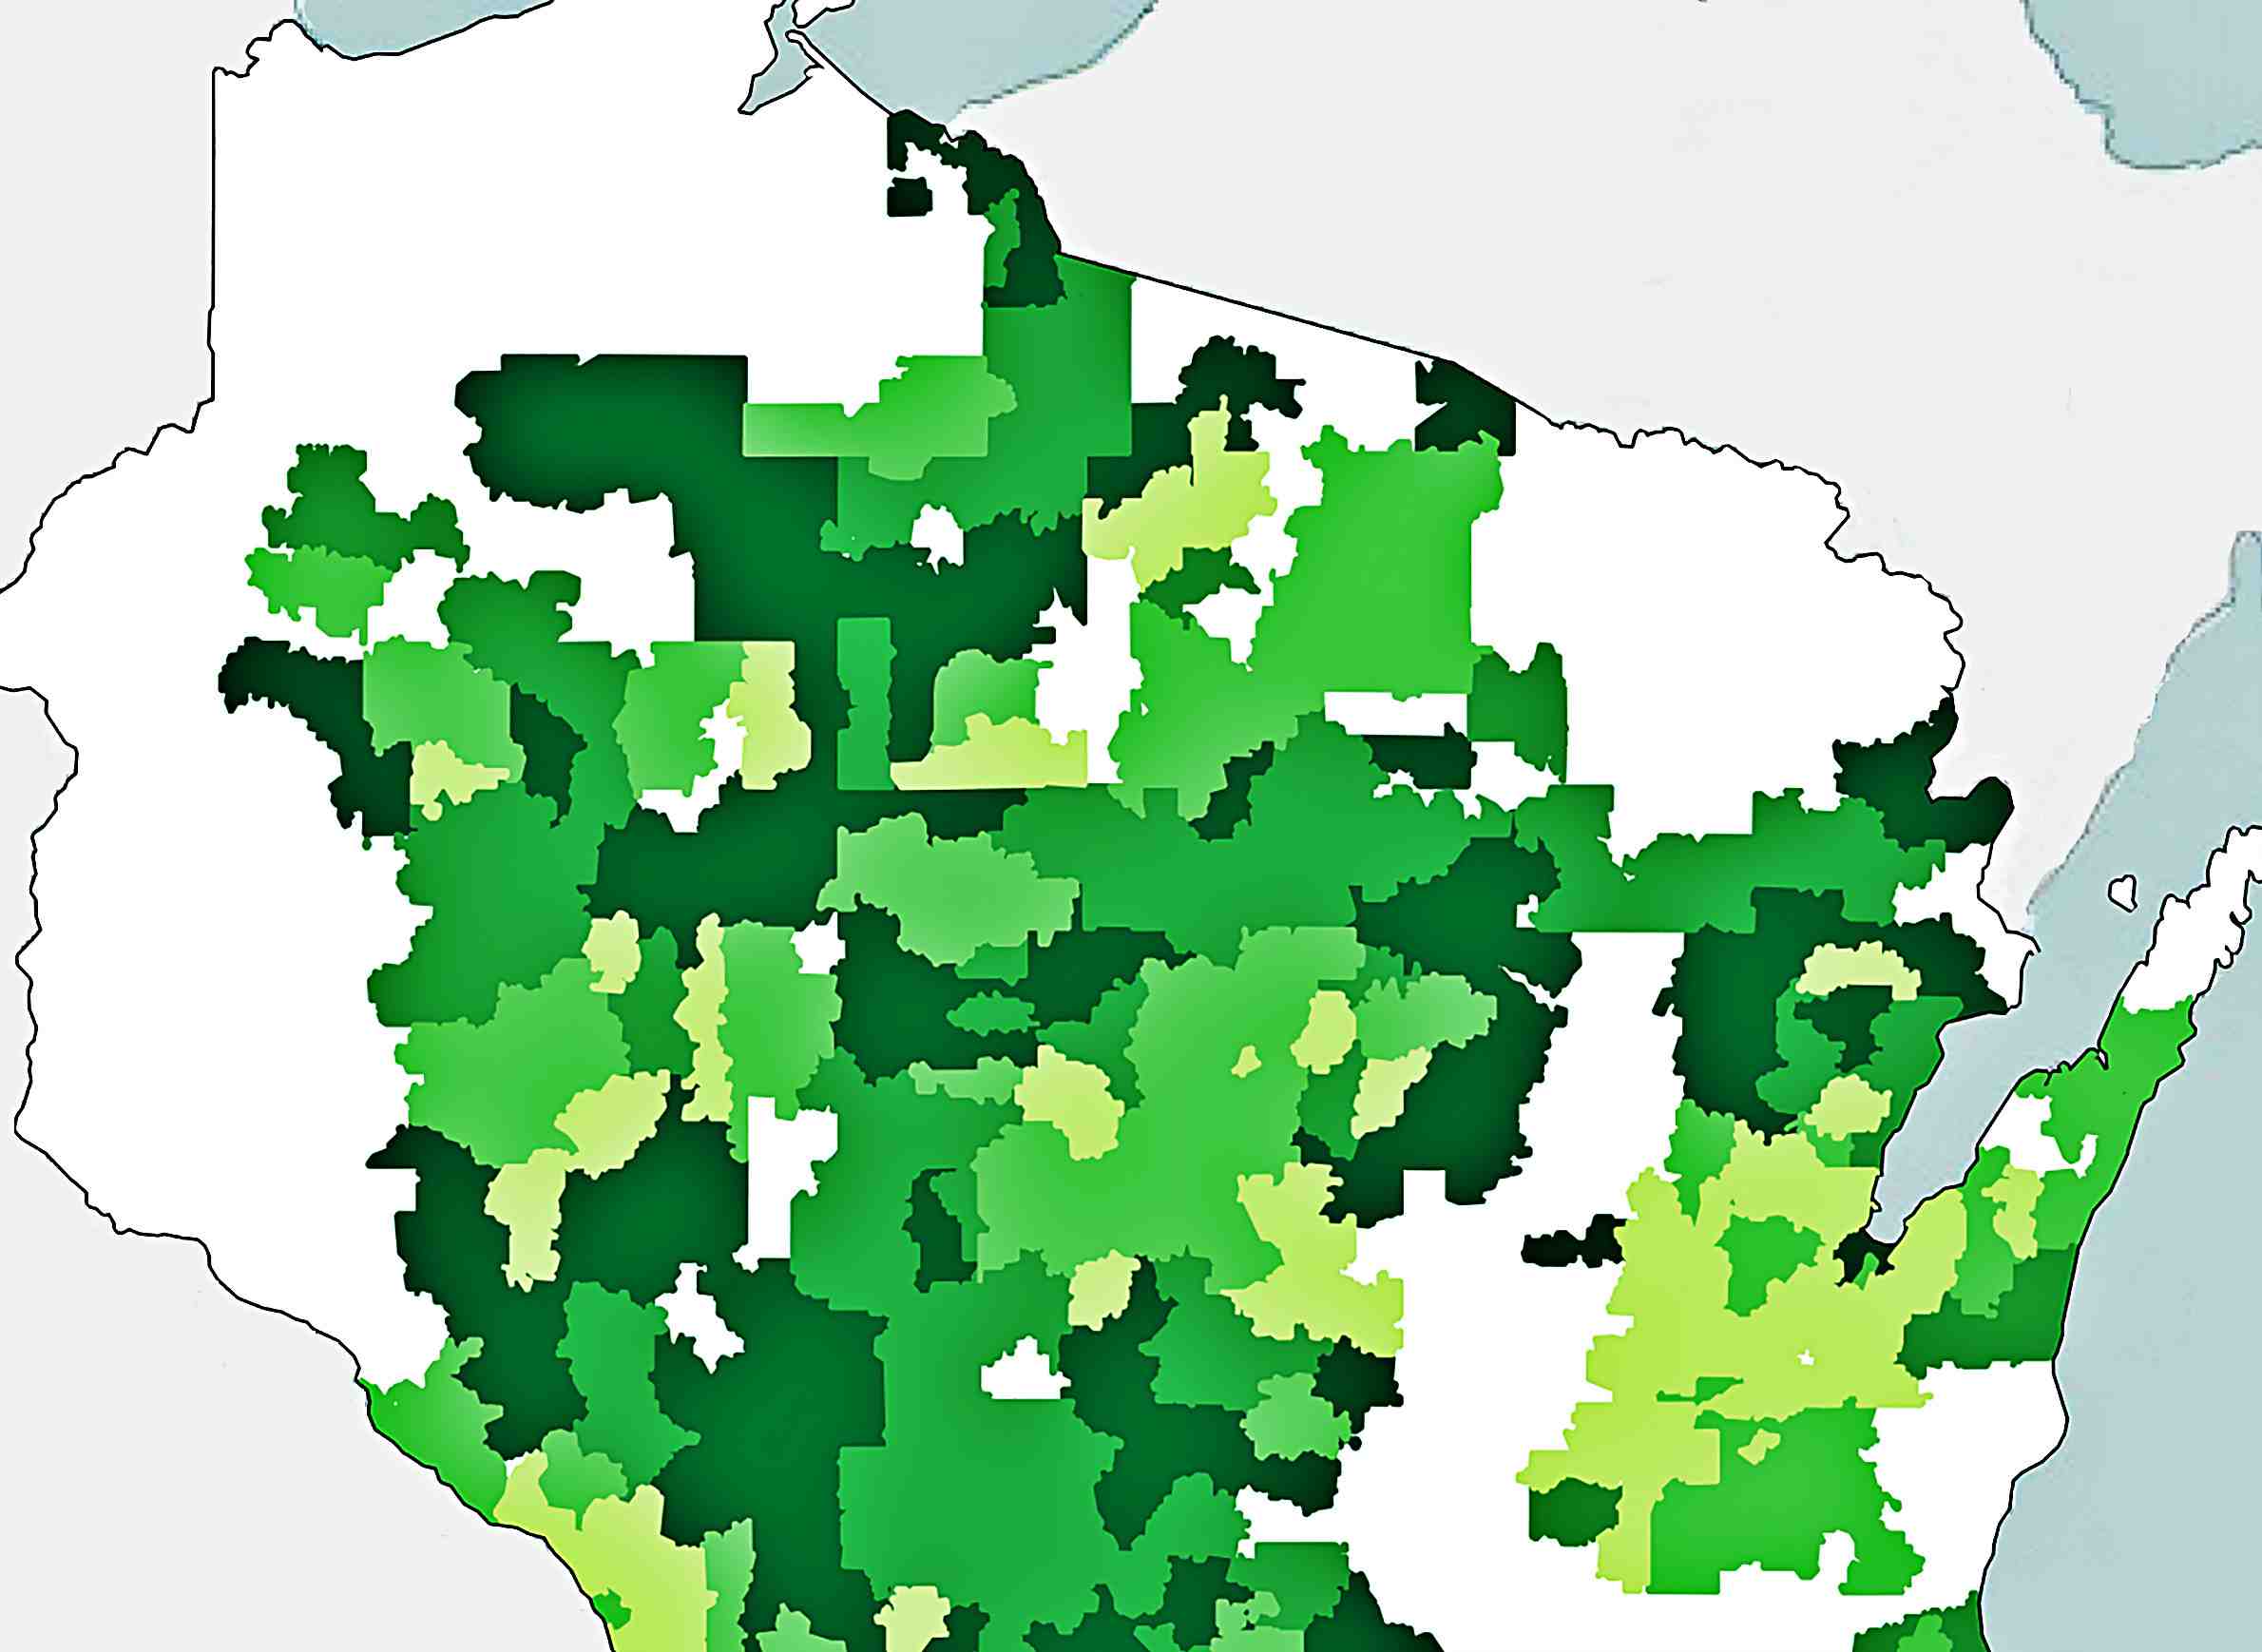

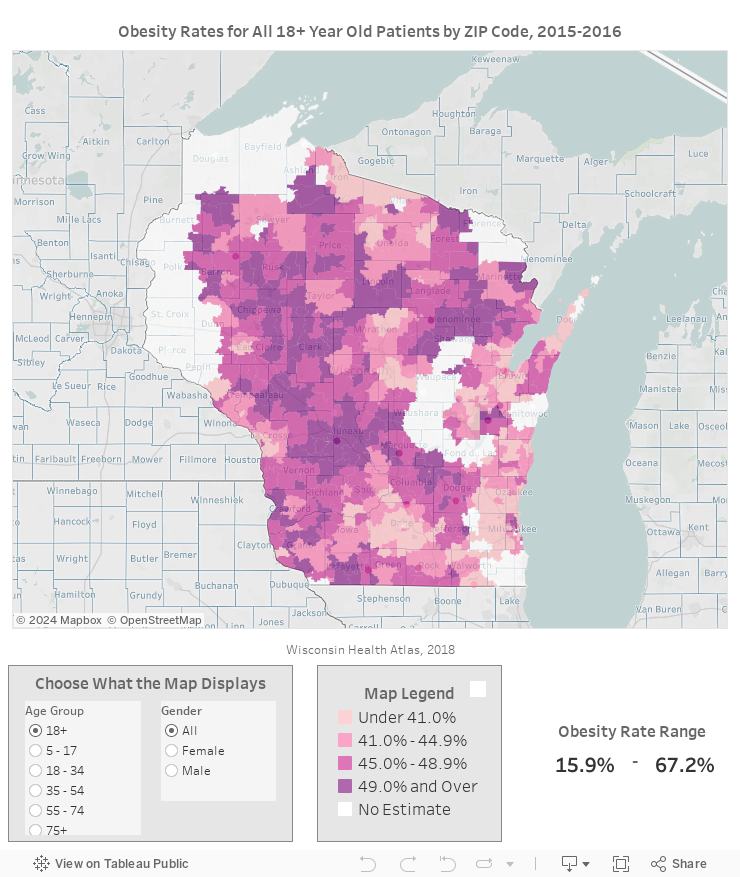
A detailed report and map released in June 2018 offer compelling evidence that obesity is an even more widespread condition in Wisconsin than health researchers previously understood. And as detailed by zip code, the map indicates that rural areas across much of the state have particularly high rates.
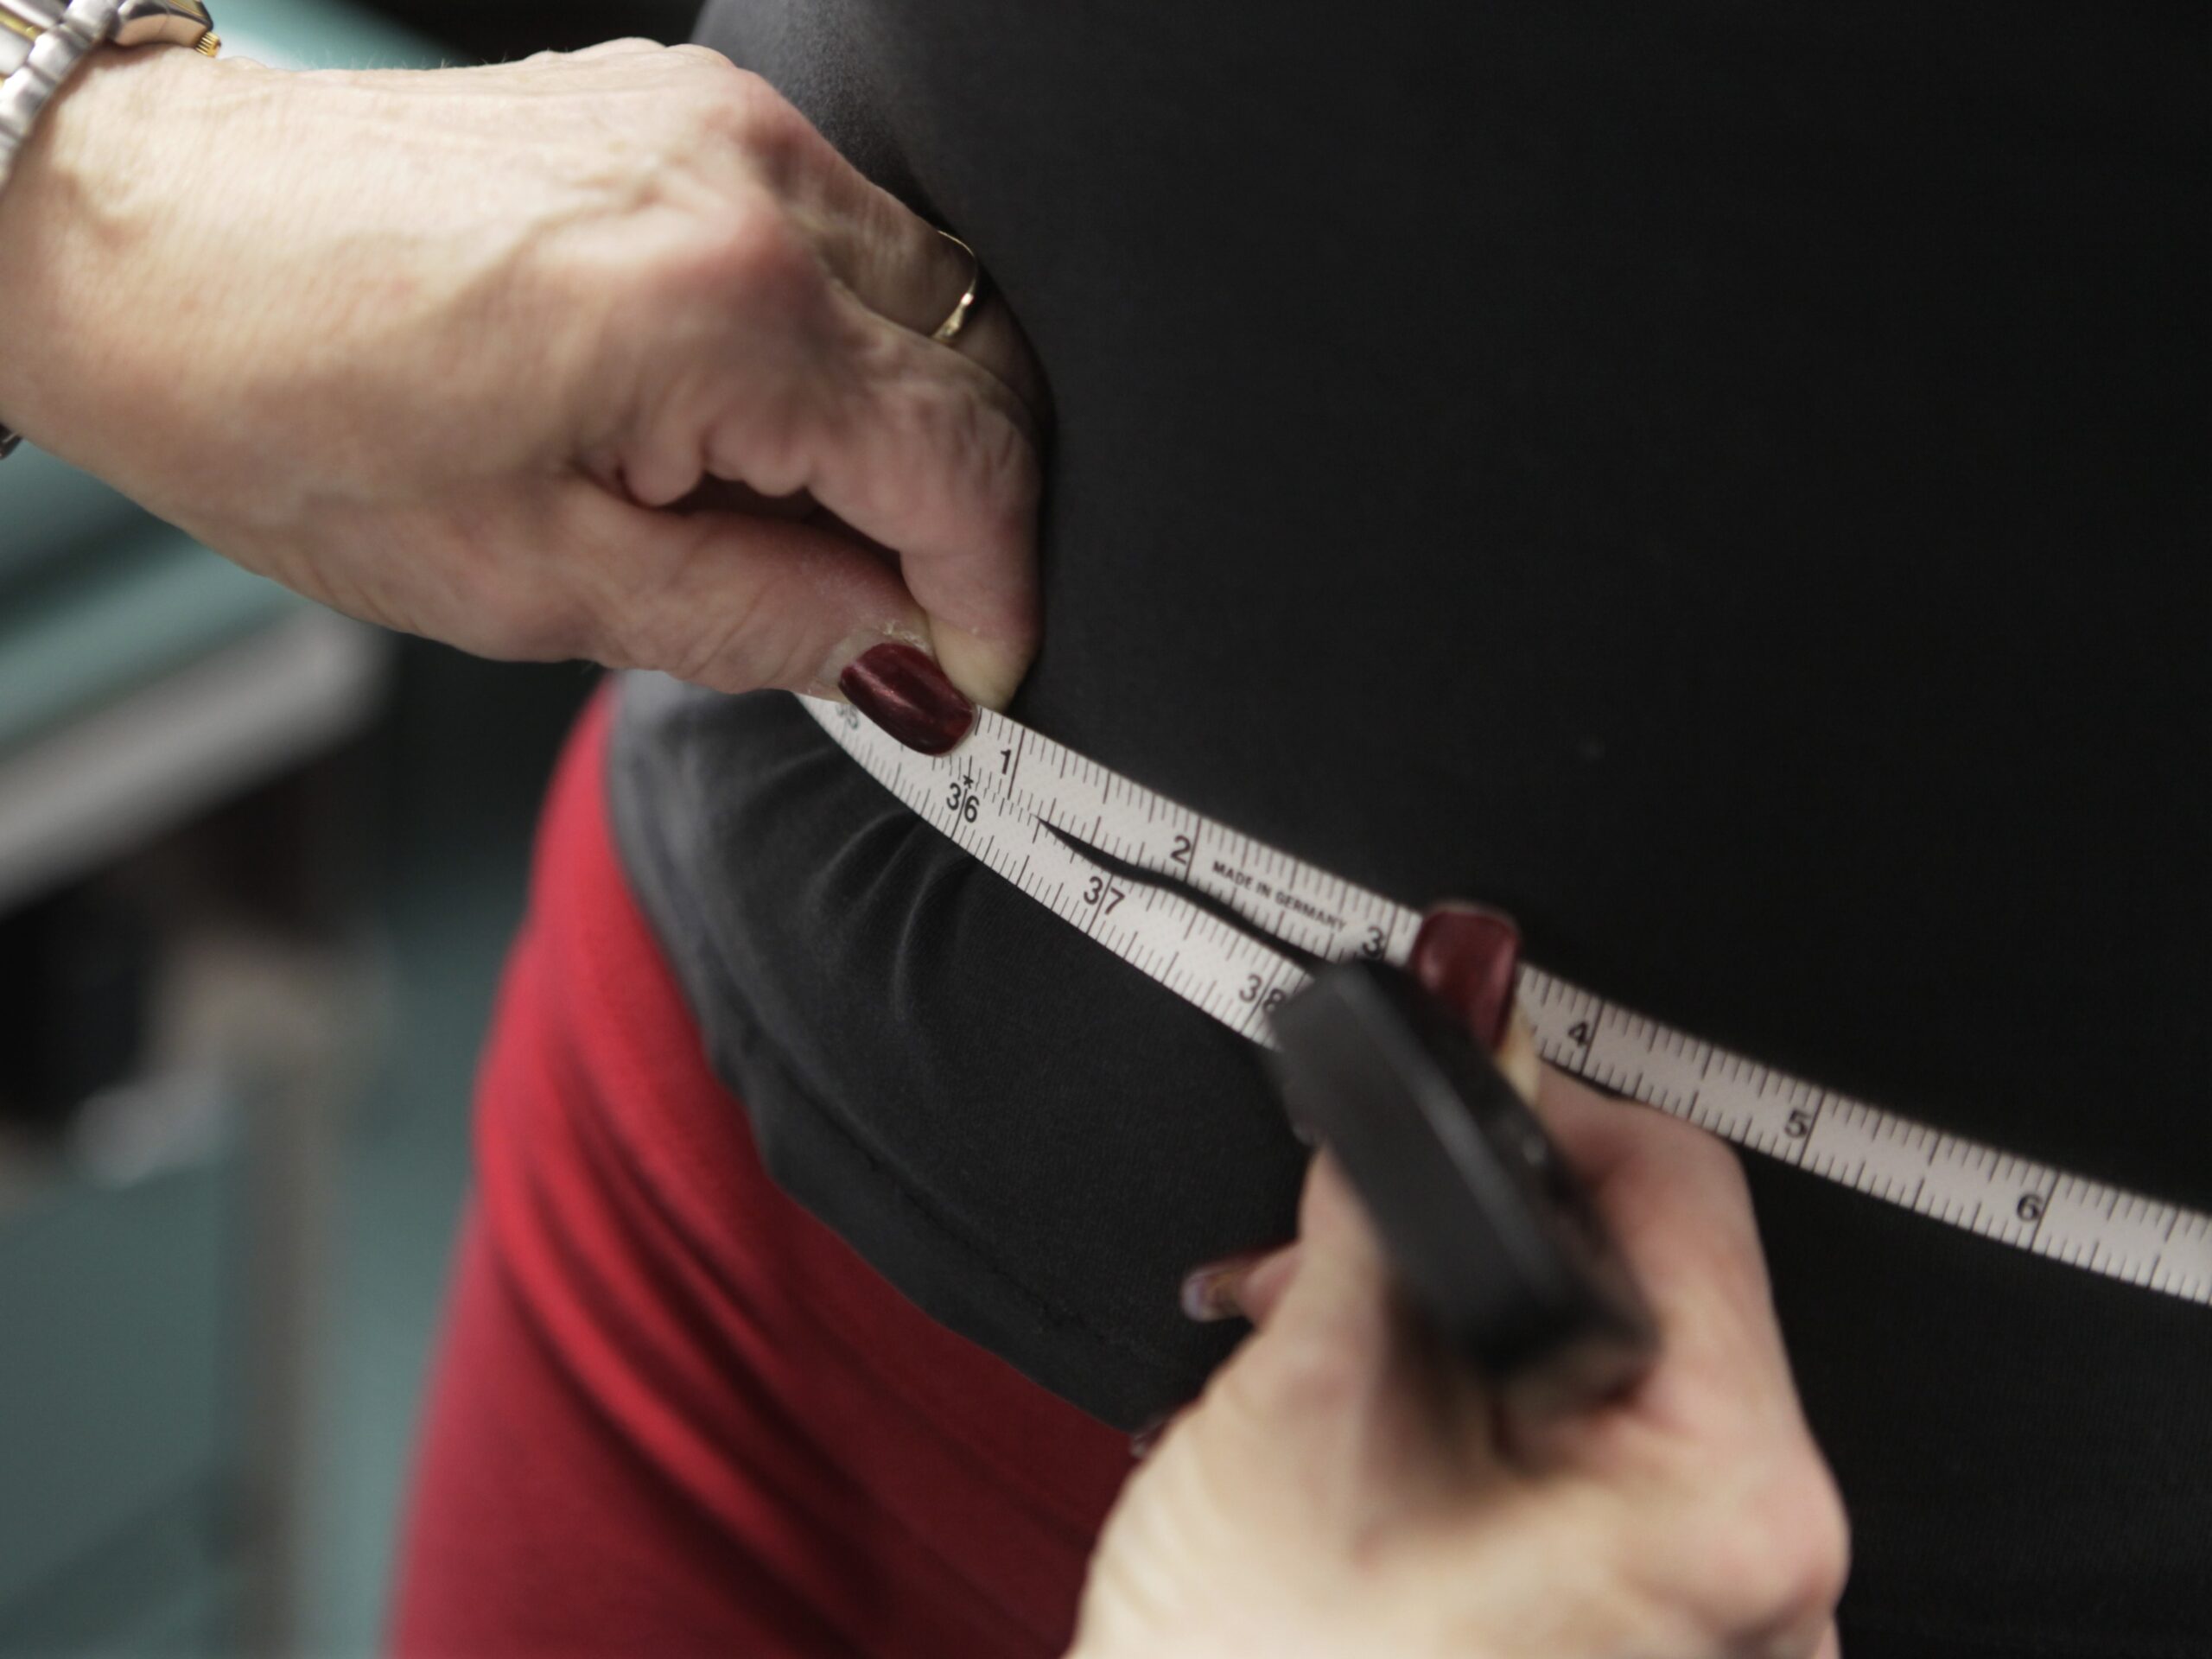
This analysis measures obesity using body mass index, a calculation based on a patient’s weight and height, and establishes different levels classified as obese among adults and children.
Stay informed on the latest news
Sign up for WPR’s email newsletter.
The map’s creators emphasize that they’re not trying to “fat-shame” people who are obese, and there are long-standing concerns about the scientific validity of using body mass index as a measure of health.
But population data about obesity is important because it doesn’t exist in a vacuum. Where people struggle with their weight, other health problems follow, from elevated risks of diabetes and heart disease. Additionally, this information may point to the role of environmental factors like a lack of access to health care and limited walkable spaces or other opportunities for exercise.
To build the map, researchers at the University of Wisconsin School of Medicine and Public Health and the Wisconsin Health Atlas used data from 1.8 million people in the state. That figure includes nearly one-third of Wisconsin’s population, and is nothing to sniff at as sample sizes go. Even the most thorough batch of data will have its gaps and shortcomings, though, and it’s part of public health researchers’ job to try to better understand the big picture in spite of that limitation.
A few broad swaths of Wisconsin are blank on the obesity map because the researchers didn’t have sufficient data to fill them in. One gap runs from Ashland County and around the western edge of the state to Buffalo County. Another takes the form crescent around the western and southern rim of the Fox Valley, running about from Shawano to Fond du Lac.
Even the people who made the map were a little surprised.
“We’re like, OK, why are there these holes here?” said Hilary Joyner, who led the map project as an assistant researcher and surveillance coordinator at UW-Madison’s Population Health Institute. “It’s something we’ve been trying to figure out and work on.”
Data is only as good as the network
One explanation is in how the Health Atlas researchers developed the map. Rather than surveying Wisconsinites and relying on self-reported data, they sourced patient records directly from health care providers around the state, stripping out personally identifying details but keeping information including age, gender, zip code of residence and BMI. The Health Atlas project obtained this data through the Wisconsin Collaborative for Healthcare Quality, a statewide network of health care providers. It means the map only includes data that comes from providers who are members of the network and are on-board with its data-gathering efforts.
This data-sharing is all voluntary, so public-health researchers have to develop rapport and trust with their partners and get them to commit staff time to tasks like de-identifying patient data. Patient privacy is protected by federal law, and health care providers might be wary of sharing that with a third party; it’s one reason why networking and communication are so essential to public health research. Clearly health care providers have a lot to gain from learning more about the health status of people in communities they cover, but the medical world can have a risk-averse culture.
“It definitely has been this trust-building exercise, because the health information is protected by HIPAA,” Joyner said. “Part of the whole process is building the trust, conveying to the healthcare providers what we are planning to do with the data.”
If a given health care system hasn’t signed on to share its data, and that system dominates a given geographic area — especially a rural area where there isn’t a large number of patients in the first place — that may explain some gaps.
Affinity Health System and Ministry Health Care each have multiple practices in the Fox Cities area and central Wisconsin, which might account for some of the missing data in that crescent around Lake Winnebago, said Matt Gigot, director of performance measurement and analysis at the Wisconsin Collaborative for Healthcare Quality. Those two health care systems weren’t members in 2015 and 2016, when the obesity map data was sourced. But since then, a different Collaborative member, Ascension, has acquired Ministry and Affinity, so that would help any future iterations of the map be more complete.
As for the big blanks in the western part of the state, the simplest explanation is that patients in these areas are getting their health care in Minnesota, or from Minnesota-based health providers with a big Wisconsin footprint.
For example, the Mayo Clinic is a major provider in some parts of this region. Some of Mayo’s bigger divisions do report data to the Collaborative, which helps to explain why places like La Crosse and Eau Claire are included on the obesity map. However, not all western Wisconsin residents who go to Mayo Clinic locations for care are necessarily included.
Minnesota-based providers are sharing data with the Collaborative’s Minnesota counterpart, Minnesota Community Measurement, so another next step might be to develop more collaboration between those two organizations.
This data obstacle seems to be less of a problem along Wisconsin’s three other borders. Gigot believes that even when Wisconsinites head into Illinois, Iowa, or Michigan’s Upper Peninsula for health care, they’re more likely to go to a branch of a Wisconsin-based provider with an interstate footprint — like Green Bay-based Bellin Health in the U.P., or UW Health in Illinois.
Why some areas get overlooked
A few public-health officials in counties with blanks on the map told WisContext they weren’t sure why data in many of their zip codes is missing on the map, and have reached out to Wisconsin Health Atlas researchers for more information
“When we saw that come out we were very curious why that was,” said Jed Wohlt, head of Waupaca County Public Health.
Local officials like Wohlt are more in touch with their communities’ health needs than a research team in Madison, but the data is still important.
“Certainly if we don’t have some of the data that we need, it can affect information that we provide to the public and affect what we do with our priorities,” he said. “Public-health is data driven.”
Kathy Munsey, health officer with the Green Lake County Health Department, said she wasn’t sure why the northern part of that county is not included on the obesity map, but can understand where some of the challenges would be.
“In some of the rural communities there are no hospital, so where do you get the data from?” Munsey said. “A lot of people in the southern part of our county go to Madison, and people in the northern part go to Oshkosh or Appleton.”
Kim Mueller, director of the Fond du Lac County Health Department, questioned the data gap as well. “I myself was wondering why we have a fairly large part of the county that has insufficient data,” she said.
The challenges in creating a statewide picture of obesity aren’t just limited to specific areas, but can be found across rural America writ large. If an area is sparsely populated, it can be hard to even gather enough data, particularly if researchers want to drill down to a specific age group, Wisconsin Health Atlas researcher Hilary Joyner said. Given that many rural areas in Wisconsin are older and aging faster than the state as a whole — and losing population, in part because fewer people are giving birth in these areas — it can be particularly difficult to gather a reliable data set on children. When the obesity map is filtered for the 5 to 17 age group, its coverage becomes far more sparse.
“If you’re talking about an area where there’s just not a lot of people living there, as a percentage of the population there just aren’t that many kids,” Joyner said.
The lack of data in itself reveals something about health and health care in rural areas. People in rural America often lack adequate access to care, and it’s hard to study the health of someone who’s not interacting with the healthcare system, said Terry O’Toole, a researcher at the U.S. Centers for Disease Control and Prevention. O’Toole co-authored a 2018 study that examined nationwide obesity disparities between urban and rural Americans.
“There are the data challenges, but there are also the environmental and systemic challenges,” O’Toole said. “We can’t look at them in isolation.”
In other words, getting more information about health in rural areas may well go hand-in-hand with other public-health efforts, from outreach about fitness and nutrition to opening new clinics.
In a similar spirit, Joyner wants future iterations of the obesity map to not just cover more ground geographically, but also help people visualize obesity rates alongside other factors that impact health. That way the map would not only have fewer blanks, but also offer some insights into how obesity interacts and correlates with myriad other aspects of people’s lives.
“We’re working on a measure of park access,” Joyner said, offering one example. “We could try adding things like access to bike paths, but also dig deeper.”
Diagnosing The Gaps In Wisconsin’s Obesity Map was originally published on WisContext which produced the article in a partnership between Wisconsin Public Radio, Wisconsin Public Television and Cooperative Extension.
This report was produced in a partnership between Wisconsin Public Radio, PBS Wisconsin and the University of Wisconsin Cooperative Extension. @ Copyright 2024, Board of Regents of the University of Wisconsin System and Wisconsin Educational Communications Board.