Twice every year, WPR, WPT and St. Norbert College conduct a survey of Wisconsinites to gauge their opinions and attitudes on certain topics.
The spring 2015 poll checked the state’s pulse on a range of questions including state policy issues and the 2016 election. Some highlights from the current survey, along with interactive data from past polls are presented below.
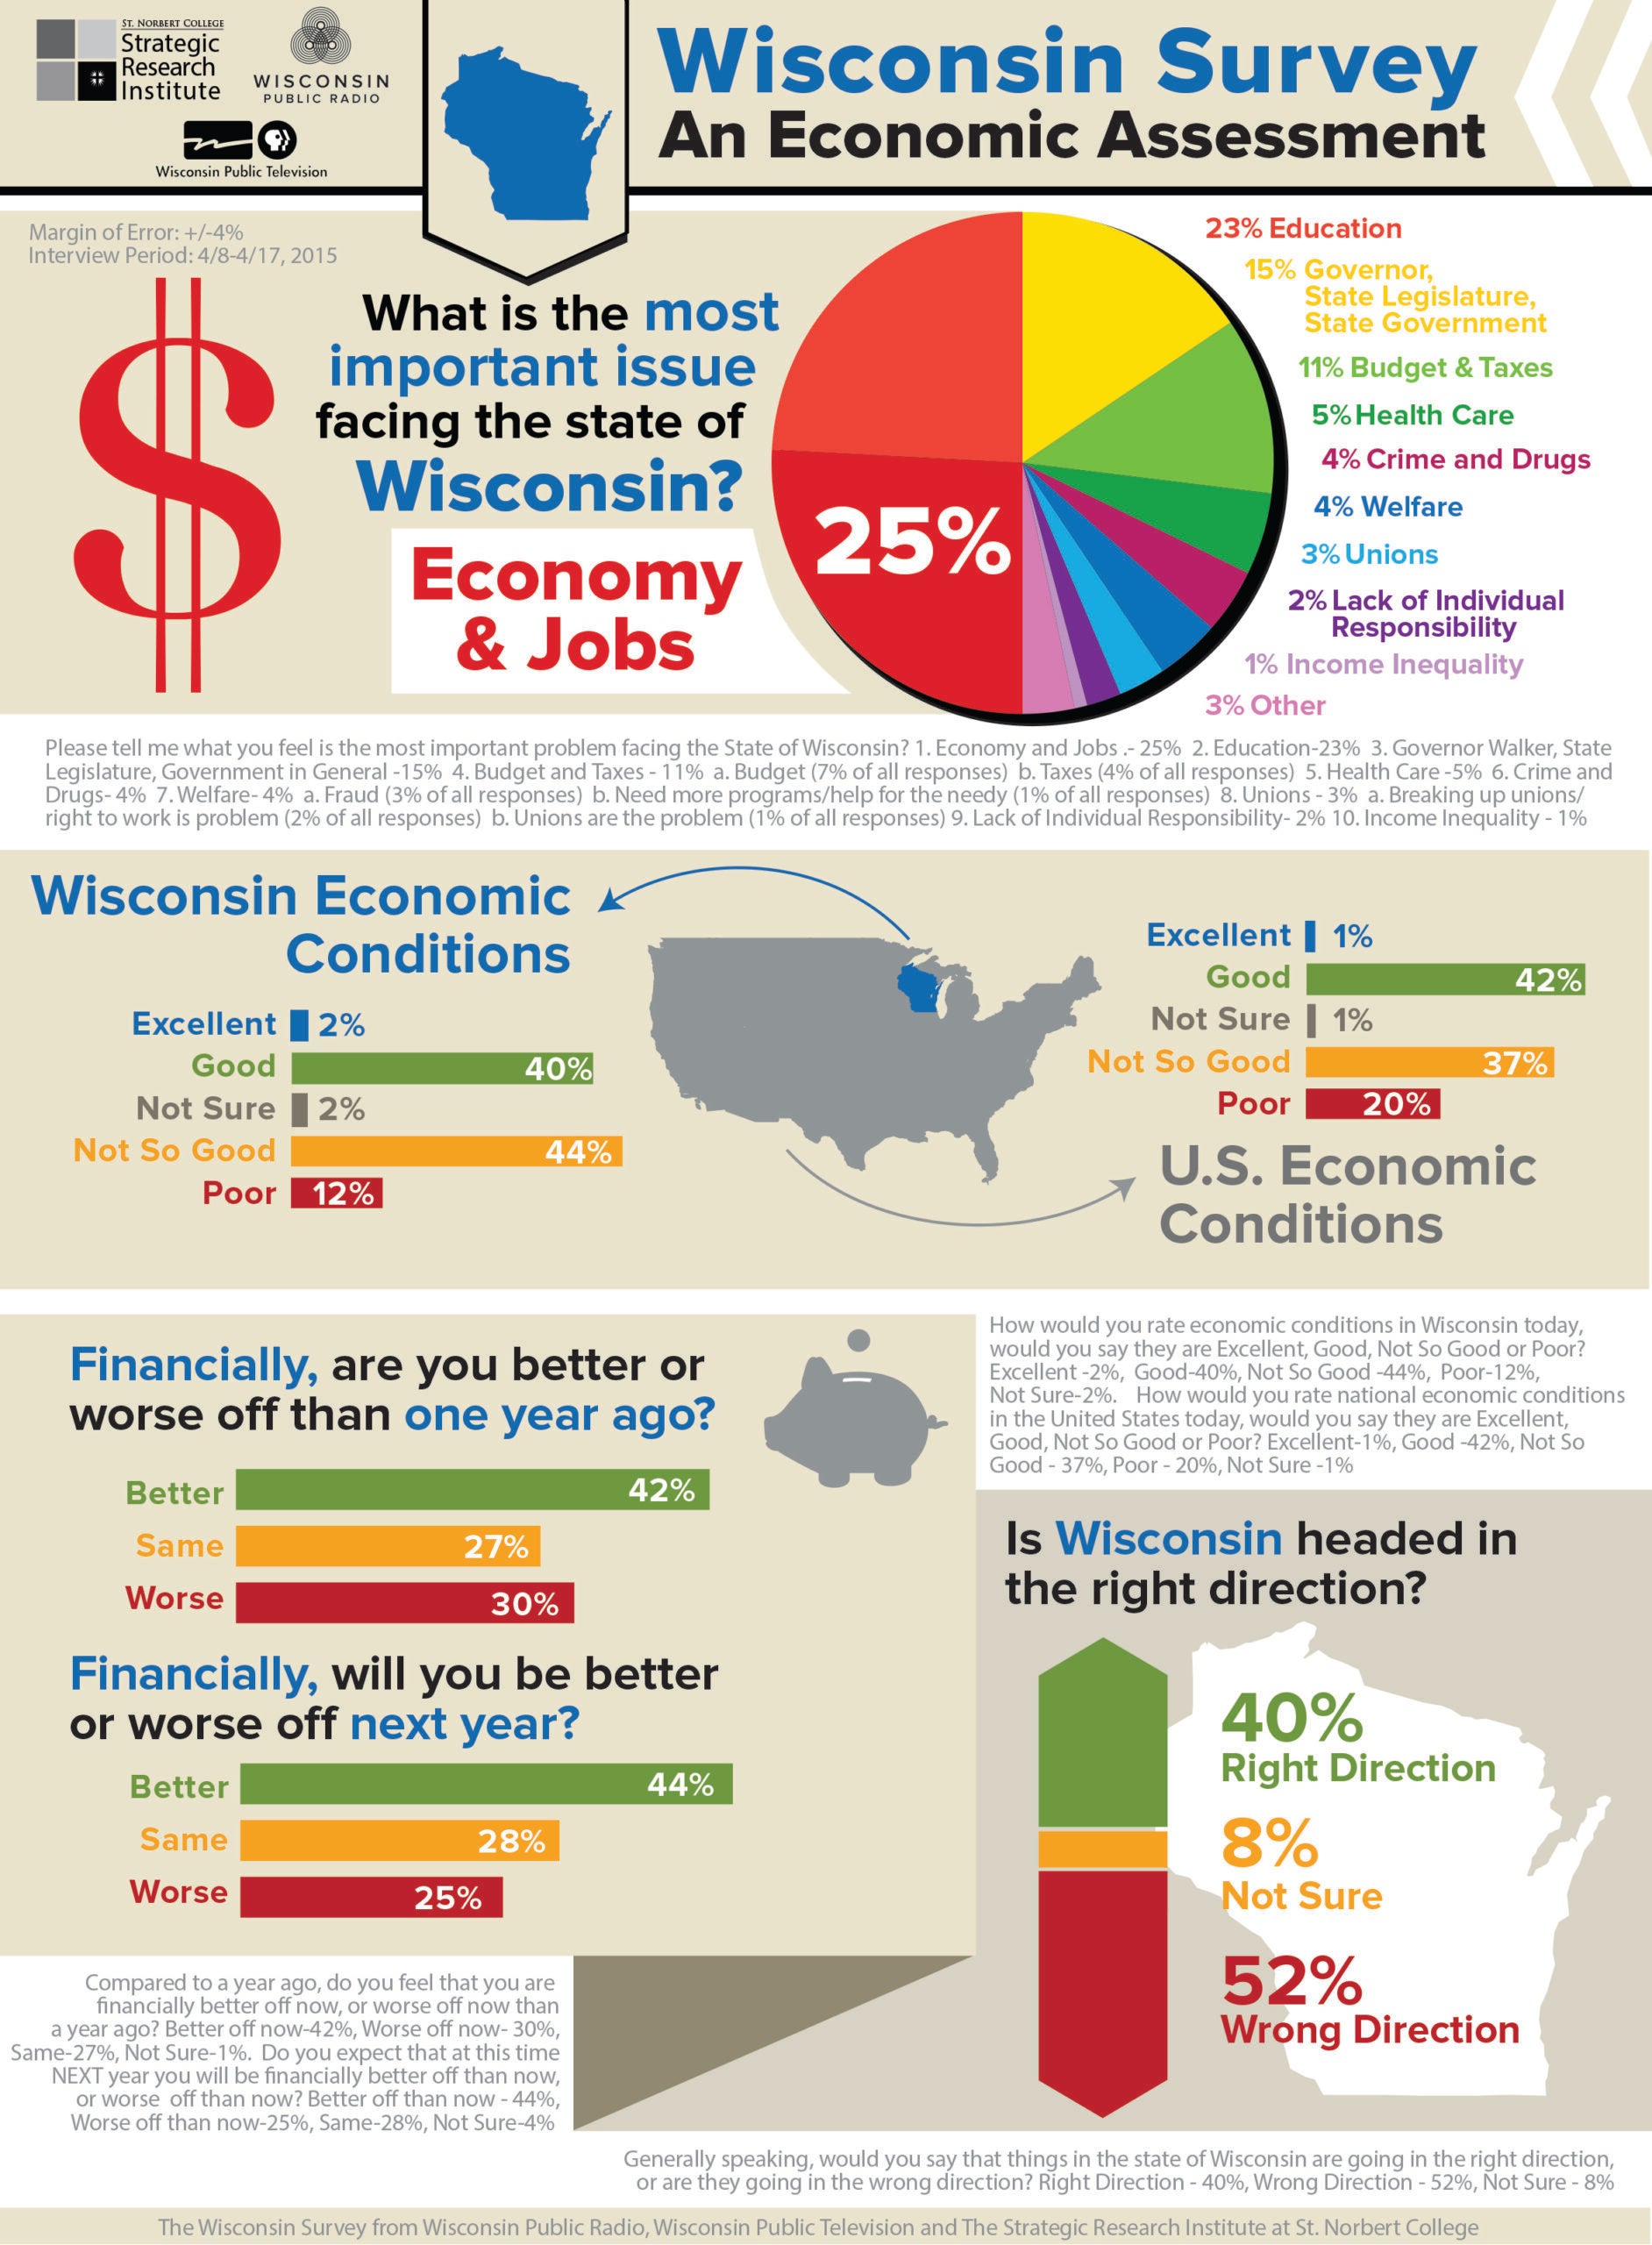
The Wisconsin Survey for spring 2015 polled 600 state residents over mobile and landline phones between April 8-17. The margin of error was plus or minus 4 percent.
Stay informed on the latest news
Sign up for WPR’s email newsletter.

Generally speaking, would you say that things in the state of Wisconsin are going in the right direction, or are they going in the wrong direction?
Right Direction 40%
Wrong Direction52%
Not Sure8%
For the first time in several surveys, more respondents said that Wisconsin is moving in the wrong direction than in the right direction. Compared to the results from fall 2014, the percentages have essentially flipped. The change is even more dramatic when compared to the poll conducted this time last year. The chart below shows how those numbers have shifted over time.
Wisconsin’s Overall DirectionNote: Data for this question was not collected in the fall 2012 Wisconsin Survey

Respondents were asked to rate their approval of various political figures including Gov. Scott Walker, Wisconsin’s U.S. senators and President Obama.
Walker’s approval numbers slid downward in the spring 2015 survey, while the number of people who disapproved of his job performance grew.
Strongly Approve 16%
Approve25%
Disapprove20%
Strongly Disapprove38%
Not Sure1%
The numbers represent a relative low point in the governor’s approval since taking office.
Gov. Scott Walker’s Job Approval
Meanwhile, President Barack Obama’s approval rating appeared to tick up slightly among Wisconsin residents but the change was within the survey’s margin of error.
President Obama’s Job Approval
Looking ahead to the 2016 election, survey respondents were asked about their views on potential presidential candidates, including Gov. Scott Walker. Walker has yet to officially announce a presidential bid but is expected to vie for the Republican nomination.

Would you favor or oppose having Gov. Walker Run for the Republican nomination?
Favor39%
Oppose59%
Not Sure2%
In terms of potential matchups in the race for president, the poll asked voters whether they would prefer Walker or Democrat Hillary Clinton. Their responses showed a close race, with a slight Clinton lead well within the margin of error.

If the Presidential election were being held today and the candidates were Republican Scott Walker and Democrat Hillary Clinton, for whom would you vote?
Scott Walker42%
Hillary Clinton44%
Some Other Candidate11%
Not Sure3%
What do you feel is the most important problem facing the state of Wisconsin? Responses included in the “Other” category included the environment, racism Infrastructure, gay marriage, movement away from religious values, illegal immigration, Milwaukee Bucks arena funding, voter fraud, and none, all of which accounted for less than 1 percent of responses.
Within the “Budget and Taxes” category, 7 percent of all responses mentioned the state budget, while 4 percent said taxes. In the “Welfare” category, 3 percent thought welfare fraud was the problem and 1 percent said it was not enough welfare services. And among responses in the “Unions” category, 2 percent said union busting and right to work laws were the problem, while 1 percent worried about the unions themselves.
A regular question on past Wisconsin Surveys has focused on how residents view their personal financial situations, both recently and in the future. Again in spring 2015, the poll asked Wisconsinites whether they were better off, worse off or the same compared to this time last year, as well as where they expected to be this time next year.
The first chart below shows that more residents felt positive about their recent financial situations, especially compared to surveys conducted in the years during the Great Recession.
Personal Finances-This YearNote: Data for this question was not collected in the fall 2014 Wisconsin Survey
As in past surveys, most respondents in spring 2015 remained optimistic about their financial futures, with 44 percent expecting to do better in the next year. But compared to past polls, the number of people who expect to stay the same or be worse off appeared to be on the rise.
Personal Finances-Next YearNote: Data for this question was not collected in the fall 2014 Wisconsin Survey.
Credits: Jennifer Hadley (Infographic Illustrations); John K. Wilson and Erik Lorenzsonn (Interactive Charts).
Editor’s note: This story has been updated to include additional Wisconsin Survey data.
Wisconsin Public Radio, © Copyright 2024, Board of Regents of the University of Wisconsin System and Wisconsin Educational Communications Board.