The latest state report cards for public schools show more Wisconsin districts are meeting expectations than last year. The report cards, out Tuesday morning, show more than 96 percent of districts are meeting expectations, up from 95 percent last year.
But the report cards are based on more than just test scores, they also consider metrics like attendance and graduation rates.
Despite the 1 percent jump, the latest district report cards show absenteeism is a growing problem for public schools and private voucher schools across Wisconsin.
Stay informed on the latest news
Sign up for WPR’s email newsletter.
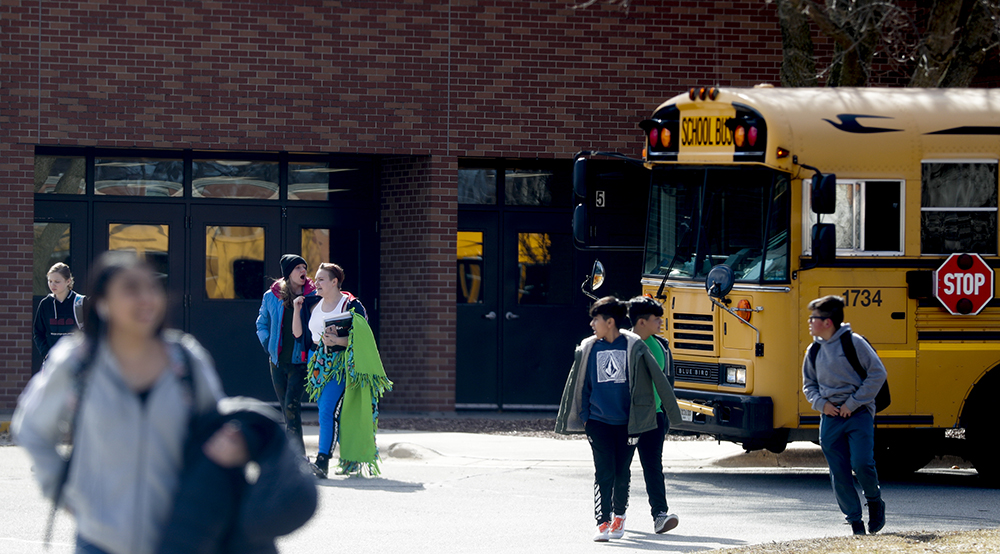
Three out of 422 school districts, and 125 public schools and private voucher schools were docked for having more than 13 percent of their students miss more than 16 percent of the school year.
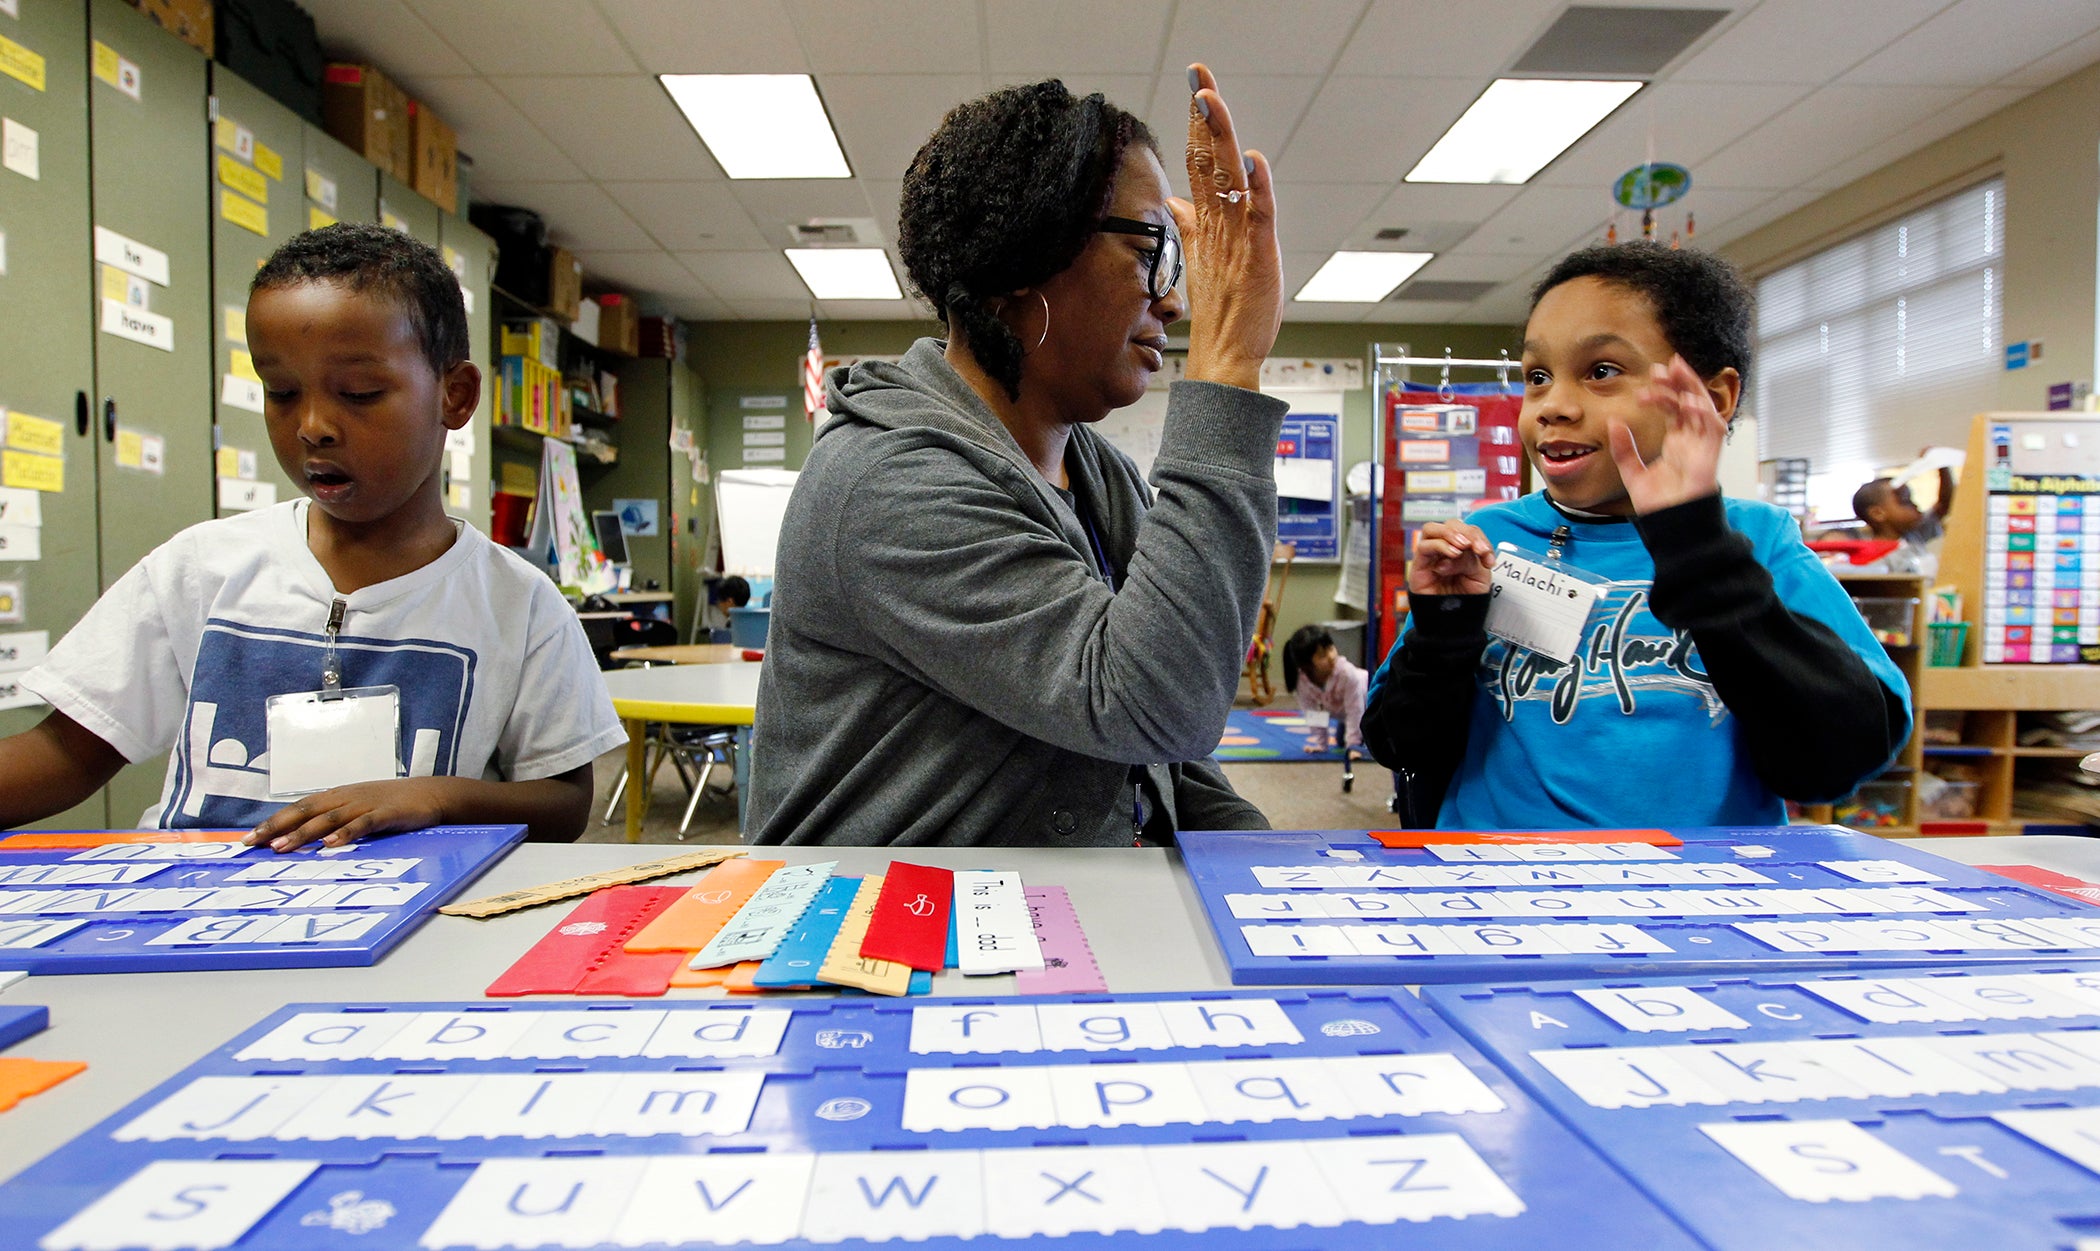
“In order to learn you have to be in school, and so regardless of the reason you’re not there, absenteeism plays a critical role,” said state Department of Public Instruction spokesman Thomas McCarthy.
Laura Pinsonneault, DPI’s director of the Office of Educational Accountability, said when students miss 16 percent or more of the school year, their state test scores typically drop.
“The more and more students are missing school, that creates churn for kind of teachers to grapple with, it creates greater challenges in delivering content when you have more disruptions in student attendance and that can impact even the students who are there every day,” said Pinsonneault.
Pinsonneault and McCarthy said they hope highlighting the missed days will spark efforts to increase attendance.
The Milwaukee Public School District, which lost points for absenteeism last year and in this round of report cards, made tackling absenteeism one of its main priorities this school year.
When it comes to broader trends in the data, lower graded schools and districts tend to have a higher enrollment of low-income students.
Of the 14 districts that met few expectations, more than 61 percent of the total students came from low-income backgrounds. These include MPS, the state’s largest district, which reported 85 percent of its students qualified for free or reduced lunch. As well as the Menominee Indian School District, which reported more than 91 percent of its students came from low-income backgrounds; and the Beloit School District, which reported more than 71 percent of its student body was low-income.
While some of the districts that scored the lowest had some of the highest levels of low-income students in the state, other districts with high numbers of low-income students received top grades despite lagging behind the state average in test scores.
Like in the 2016-17 report cards, no school districts failed to meet expectations in the 2017-18 report cards released Tuesday. Ninety-five schools failed to meet expectations and 249 schools met few expectations.
Where Report Cards Require Closer Looks
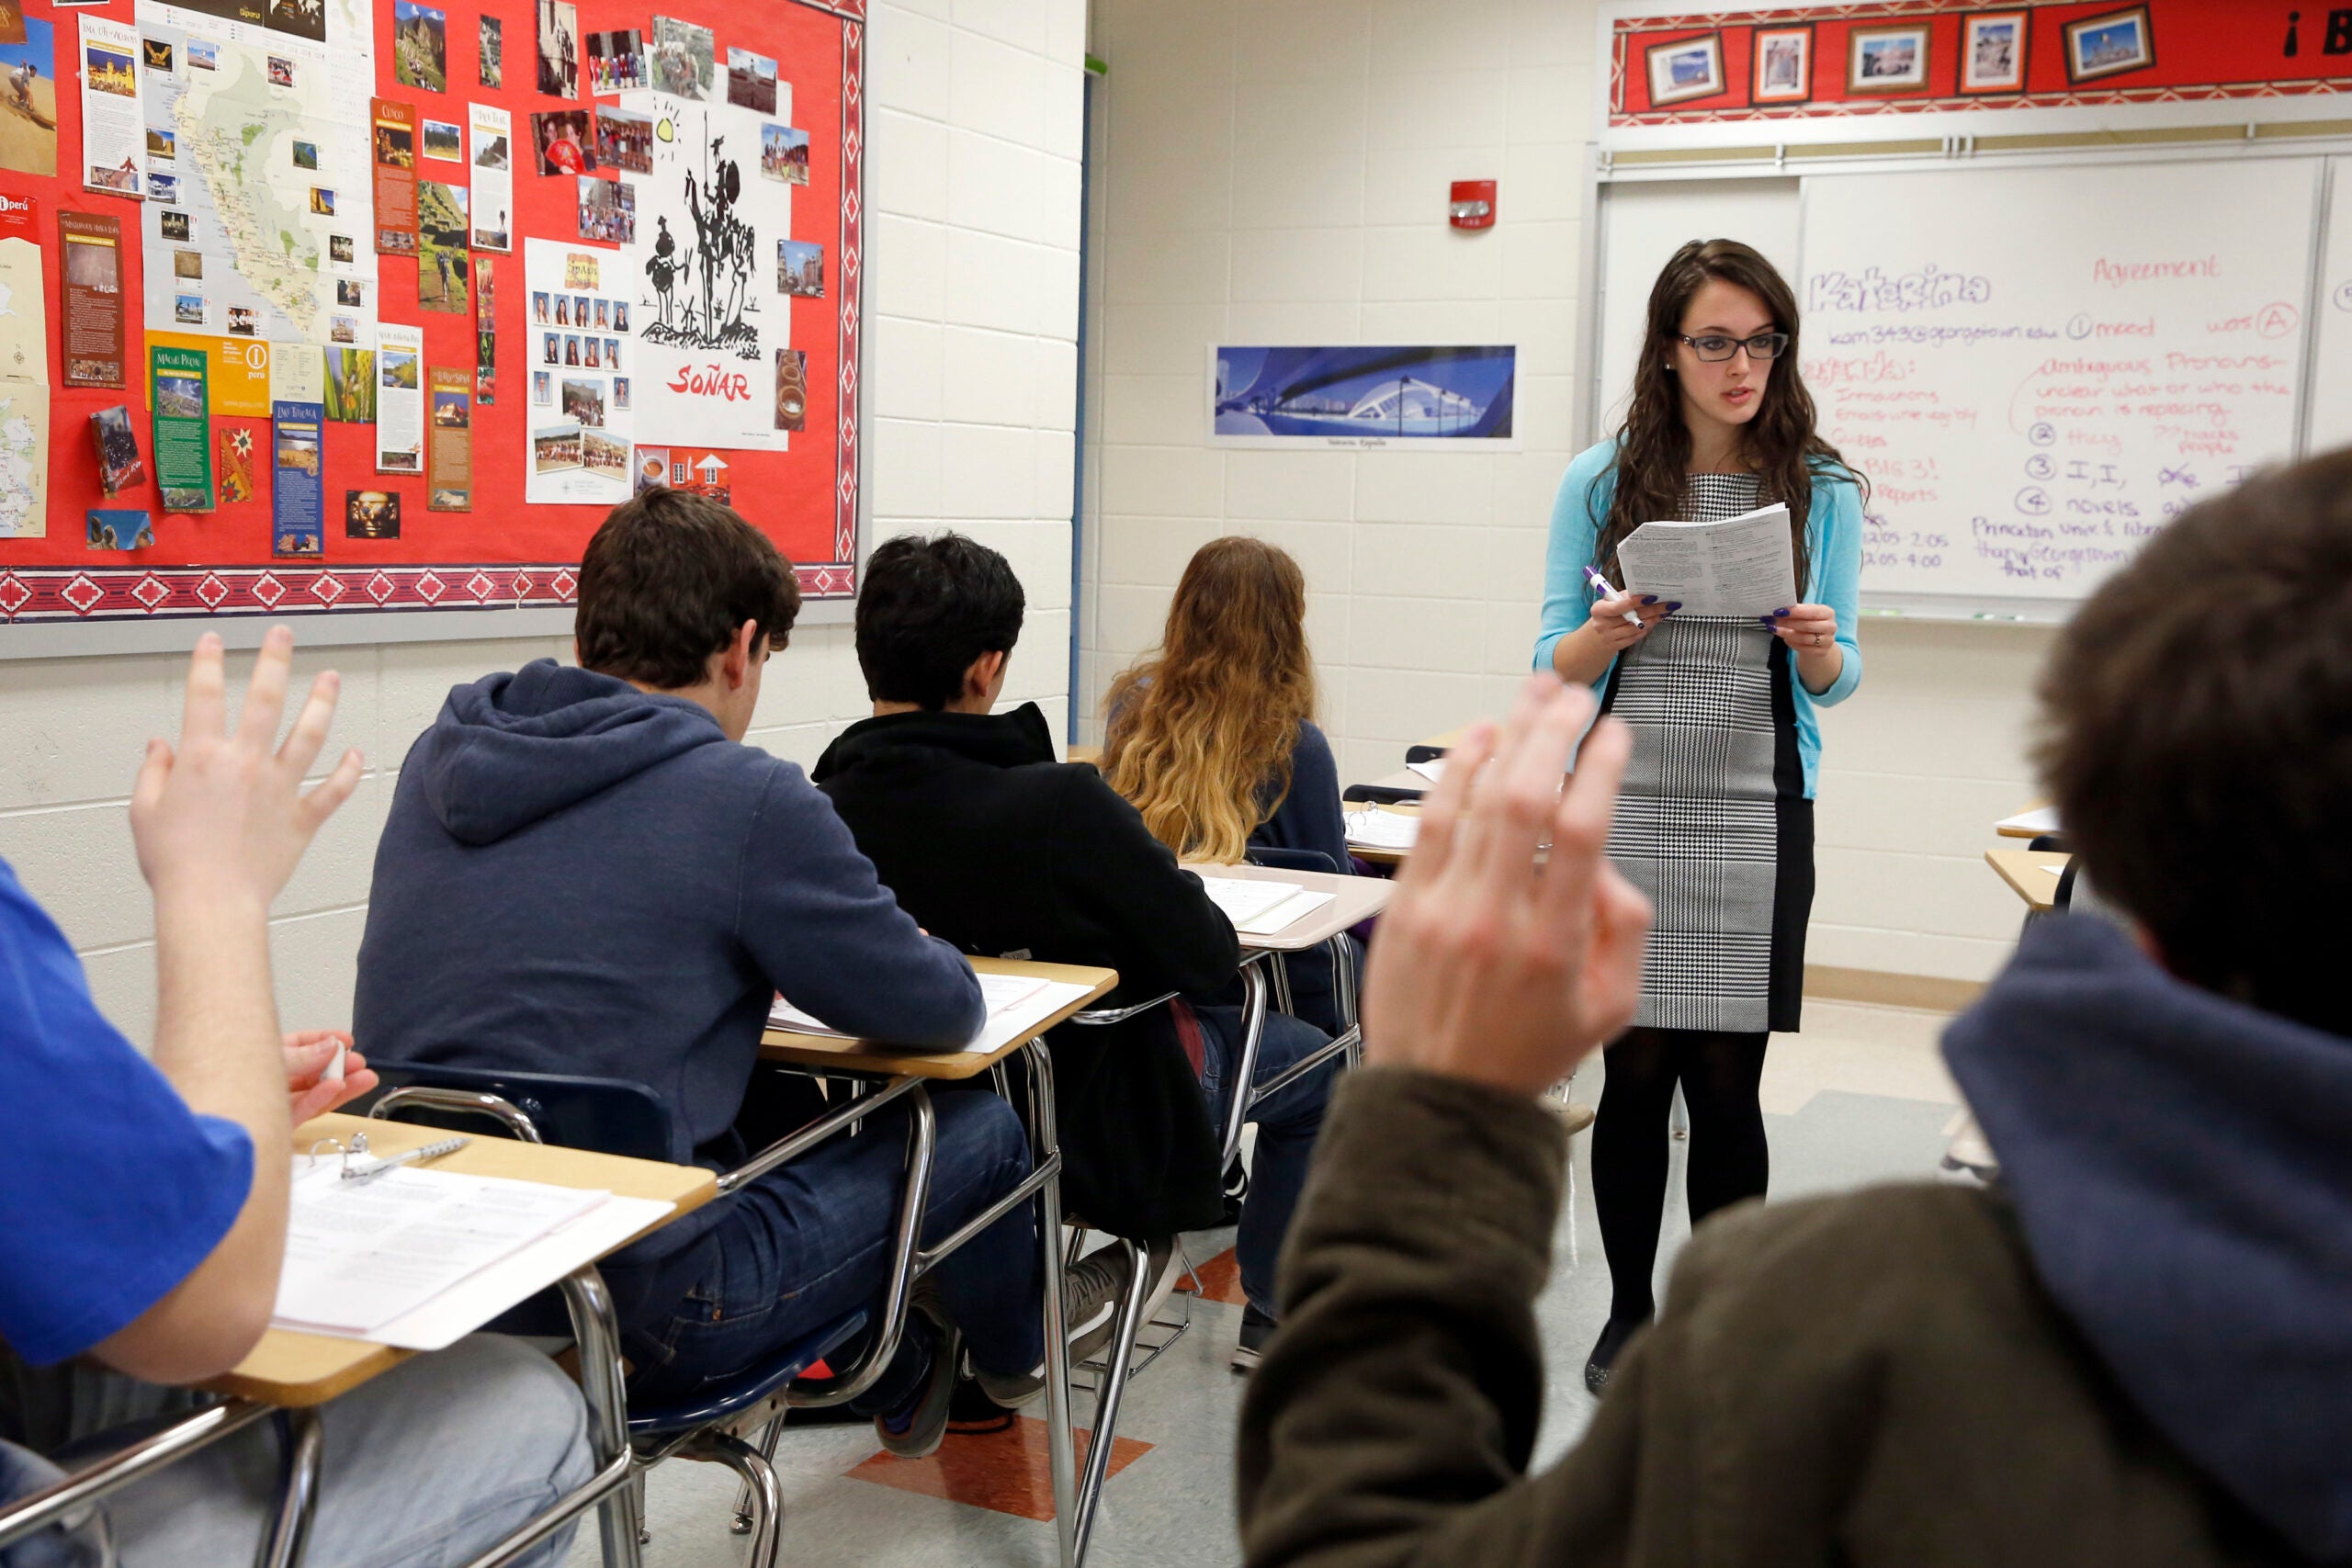
The report cards measure three other categories besides test scores, including how students are improving on those test scores from year to year and how districts are closing achievement gaps between groups of students.
The fourth major category DPI uses to grade a district or school is how on-track students are in school. That’s determined by looking at attendance or graduation rates and state test performance in key grades. These indicators are supposed to speak to a student’s post-secondary readiness.
Absenteeism and dropout rates can make it so districts lose points. Closing the achievement gaps and postsecondary readiness categories are given equal weight.
The achievement and growth are weighted on a sliding scale if a district has more than 65 percent of low-income students on its rolls. The higher the number of low-income students, the more weight will be given to improvement, or what the district labels growth, over test scores.
The Abbotsford School District, for example, exceeds expectations on its report card despite having test scores lower than the state average. With almost 69 percent of its students qualifying for free and reduced lunch, year-to-year student improvement is weighted higher.
So does this sliding scale help the district? Yes, but the district gets high marks for closing its achievement gap, too.
Abbotsford School District Accountability Coordinator Georgia Kraus said the district offers extensive services to help students performing below grade level.
“So it’s before school, it’s after school, it’s the response to intervention where we have the reading and math interventionists and just the idea that the universal education also has to be strengthened,” she said.
More than 48 percent of the K4-12 district is Latino, and Kraus said a lot of the students are English language learners, which presents another difficulty in testing.
Kraus said the district is working to expanded its 4K program to four days this year and is offering a dual-language program in continued efforts to improve achievement.
Wisconsin Public Radio, © Copyright 2024, Board of Regents of the University of Wisconsin System and Wisconsin Educational Communications Board.